Does $NVDAB Sustain the Pressure?
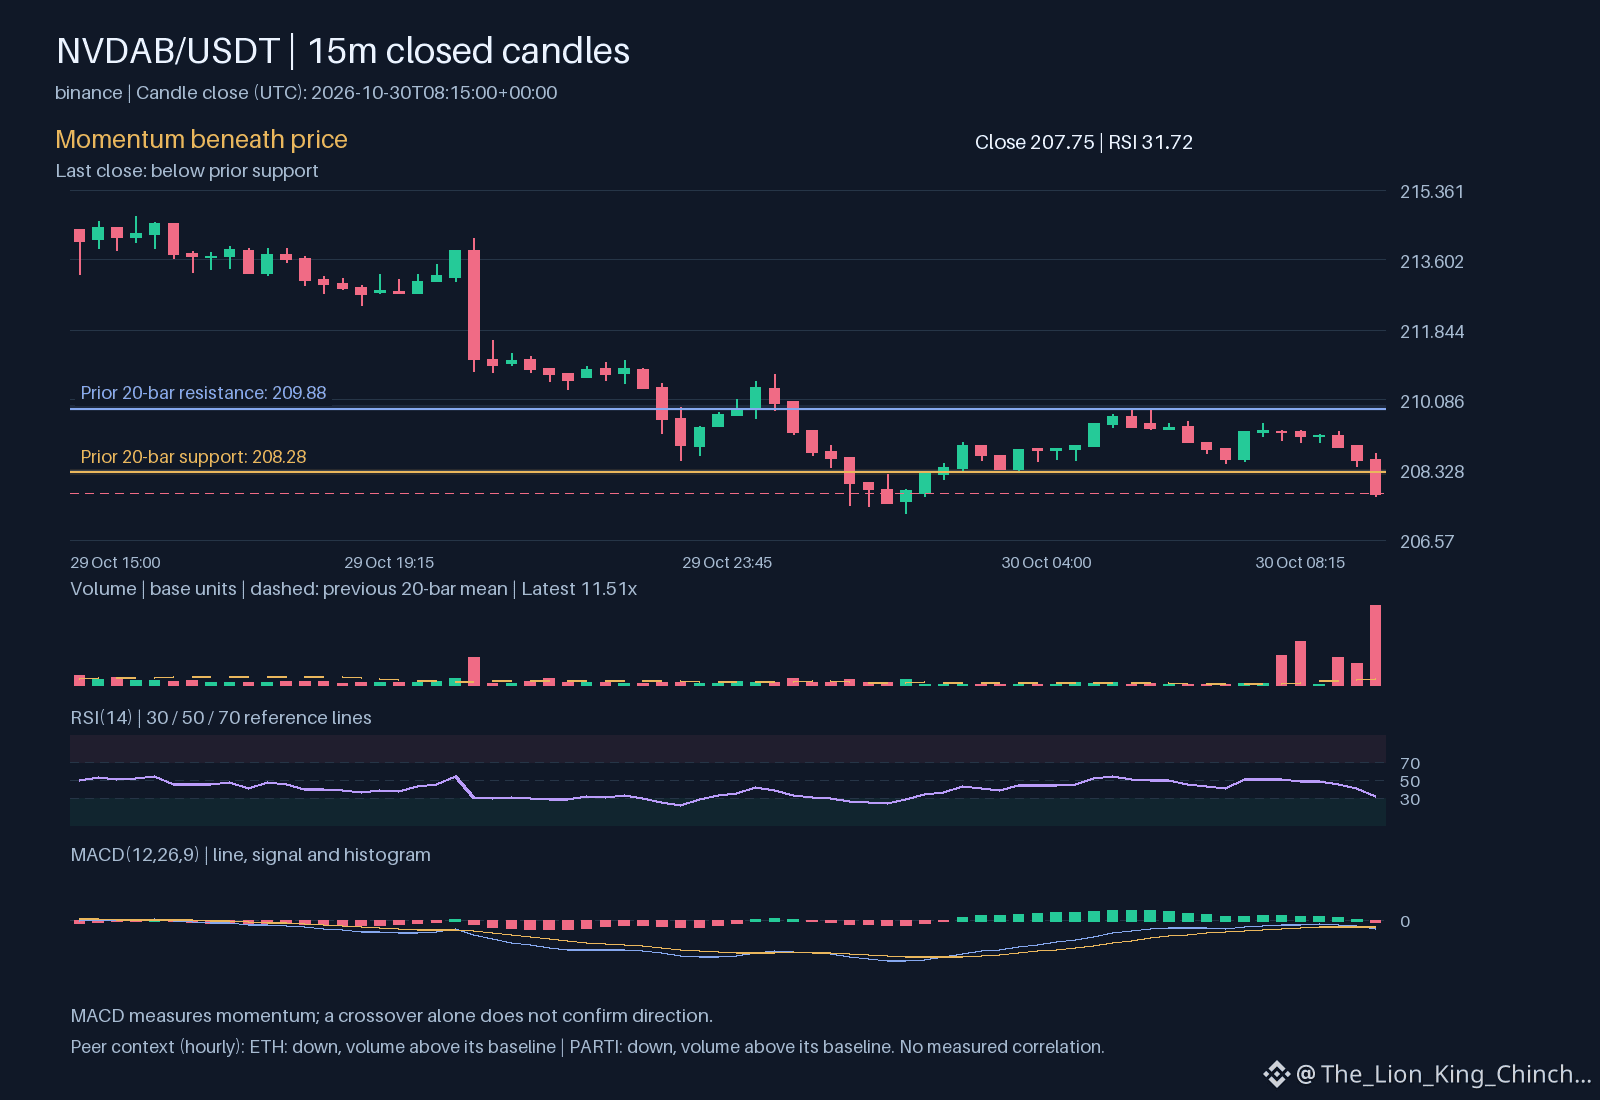
Understanding the distinction between a sudden price drop and a sustained trend is vital for risk management. For $NVDAB , the hourly direction is down while trading volume remains above baseline. This suggests active participation during the decline, yet one must ask if the move holds or simply signals a temporary liquidity grab. Comparing $NVDAB to peer assets helps clarify the broader context without assuming a shared cause. Both ETH and PARTI also show an hourly direction down with volume above their baselines. Although all three assets are moving in the same direction on the same venue, this does not establish a measured correlation or shared sector momentum.
One mechanism to watch is how price reacts when it is below support at 208.28. In a thought experiment, if $NVDAB remains below this level while the RSI sits at 31.7206, the downward pressure might be consolidating rather than exhausting. Unlike a simple leaderboard ranking, these observations require looking at the MACD of -0.236617 and the MACD signal of -0.183441 to see if the bearish momentum is accelerating. To reassess this interpretation, observe whether the daily change of -2.83884 begins to stabilize near the VWAP of 211.099. The hourly differences between these assets remind us that direction alone is secondary to how the price eventually settles.
Probabilistic market research, not a recommendation or guaranteed return.
The comparison to keep in mind: $ETH has hourly direction down and volume above its baseline; $PARTI has hourly direction down and volume above its baseline. This alone does not establish correlation.
Which matters more in this comparison: direction or how the move holds?
#NVDAB #ETH #PARTI