



Chart: PUMP/USDT Perpetual, 1H, Binance. Last price 0.004120 (+1.50%). Time: Oct 29, 21:57 UTC.
What the chart shows
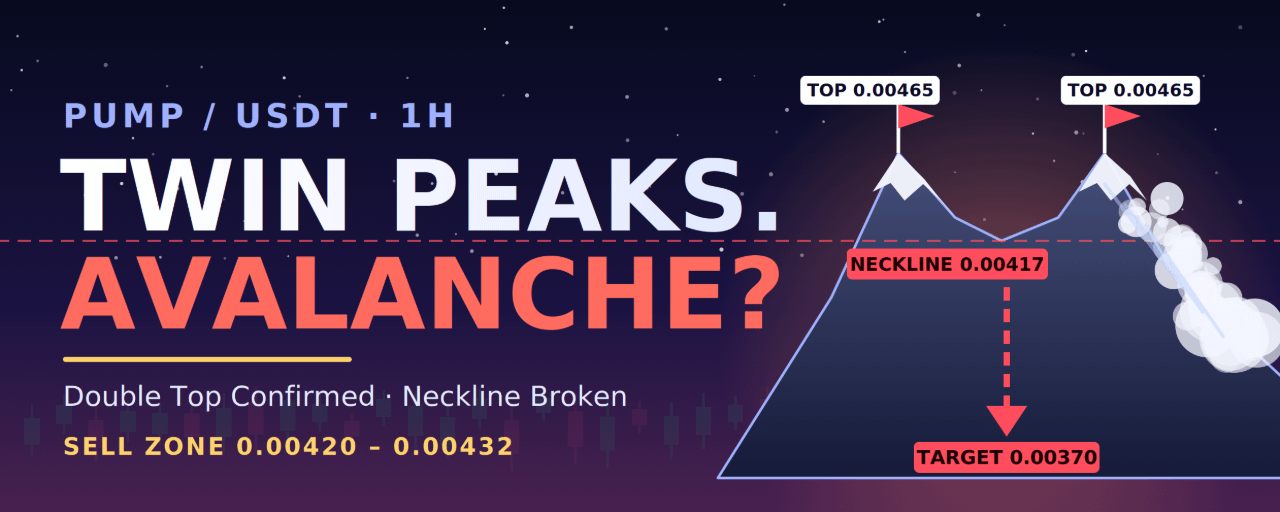
Two equal highs: PUMP topped near 0.00465 on October 28, pulled back, then ran back to the same level on October 29 and failed again. Two matching highs, with sellers capping both, is a classic double top.
Neckline: the low between the two tops sits around 0.00417, which is the level to watch.
Breakdown: a large red 1H candle sliced through the neckline and dumped price to a low near 0.003943, which you’ve labelled HL.
Rejection bounce: the latest candle bounced to 0.004262, but that high was rejected and the candle closed at 0.004120, back below the neckline.
Retracement levels: measured from the 0.003943 low to the 0.00465 top, they sit at about 0.004213 (38.2%), 0.004297 (50%) and 0.004380 (61.8%).
Supply gap: a bearish FVG sits at about 0.00425–0.00440, right where the retracement levels cluster.
Measured move: the pattern is about 0.00048 tall (0.00465 minus 0.00417). Projecting that below the neckline points to roughly 0.00370.
Note that the neckline and level readings come from the chart image, so they are close approximations. Check them on your own screen.
Why it could still bounce
The dump already covered a good part of the measured move (price fell from 0.00417 to 0.003943). The bounce also left a long lower wick, so some buyers are active near 0.0040. Shorting right here, below the neckline and above support, is not the best entry.
Trade plan (short bias)
Setup A: short the neckline retest (preferred)
Entry zone: 0.00420–0.00432, the old neckline, the 38.2%–50% retracement and the base of the bearish FVG
Stop loss: 0.00444, above the FVG top and the 61.8% level
TP1: 0.00400
TP2: 0.00394, the swing low
TP3: 0.00382
TP4: 0.00370, the measured-move target
Setup B: breakdown short
Trigger: a 1H candle close below 0.00394
Entry: 0.00392–0.00394 on a failed retest from below
Stop loss: 0.00405
Targets: 0.00382, then 0.00374, then 0.00370
Measured from a 0.00426 entry to the 0.00444 stop, Setup A pays about 1.4R at TP1, 1.8R at TP2, 2.4R at TP3 and 3.1R at TP4. Setup B is tighter, with about 0.9R at the first target and about 1.8R at the last. After TP1, consider moving the stop to breakeven.
What invalidates the bearish idea
A 1H close above 0.00444 means buyers reclaimed the supply gap and the 61.8% level.
A strong close above the neckline area and the 0.00432 zone would turn the breakdown into a failed breakdown, which often squeezes shorts.
A close above 0.00465 would cancel the double top completely. In that case, look for a retest of 0.00465 as support, with 0.0047 and 0.0048 above.
Live cross-check
I tried to cross-check the live PUMP price, but the results were not reliable. Many Solana DEX pages carry copycat tokens that use the PUMP symbol, and the quotes I found were undated and ranged from about $0.0012 to $0.05. One CoinGecko snapshot showed a 2026 low near $0.0012, which would put the chart’s 0.0041 well above that, but I can’t confirm the timing. I used the timestamped Binance chart price of 0.004120 as the reference. Confirm the current price on the Binance PUMPUSDT contract before entering.
Bottom line
Bearish, with the double top confirmed. The best trade is to sell a retest of 0.00420–0.00432 with a stop above 0.00444 and targets down to 0.00370, or to short a confirmed 1H close below 0.00394. A 1H close above 0.00444 weakens the idea, and above 0.00465 cancels it.
⚠️ Disclaimer: This is not financial advice. This analysis is for educational and informational purposes only. Crypto markets are highly volatile, and you can lose your capital. Always do your own research, manage your risk, and never trade with money you can’t afford to lose.
@Binance Square Official #FedWatch #EarningsSeason #USMidtermElections #Binance #ChartSniper