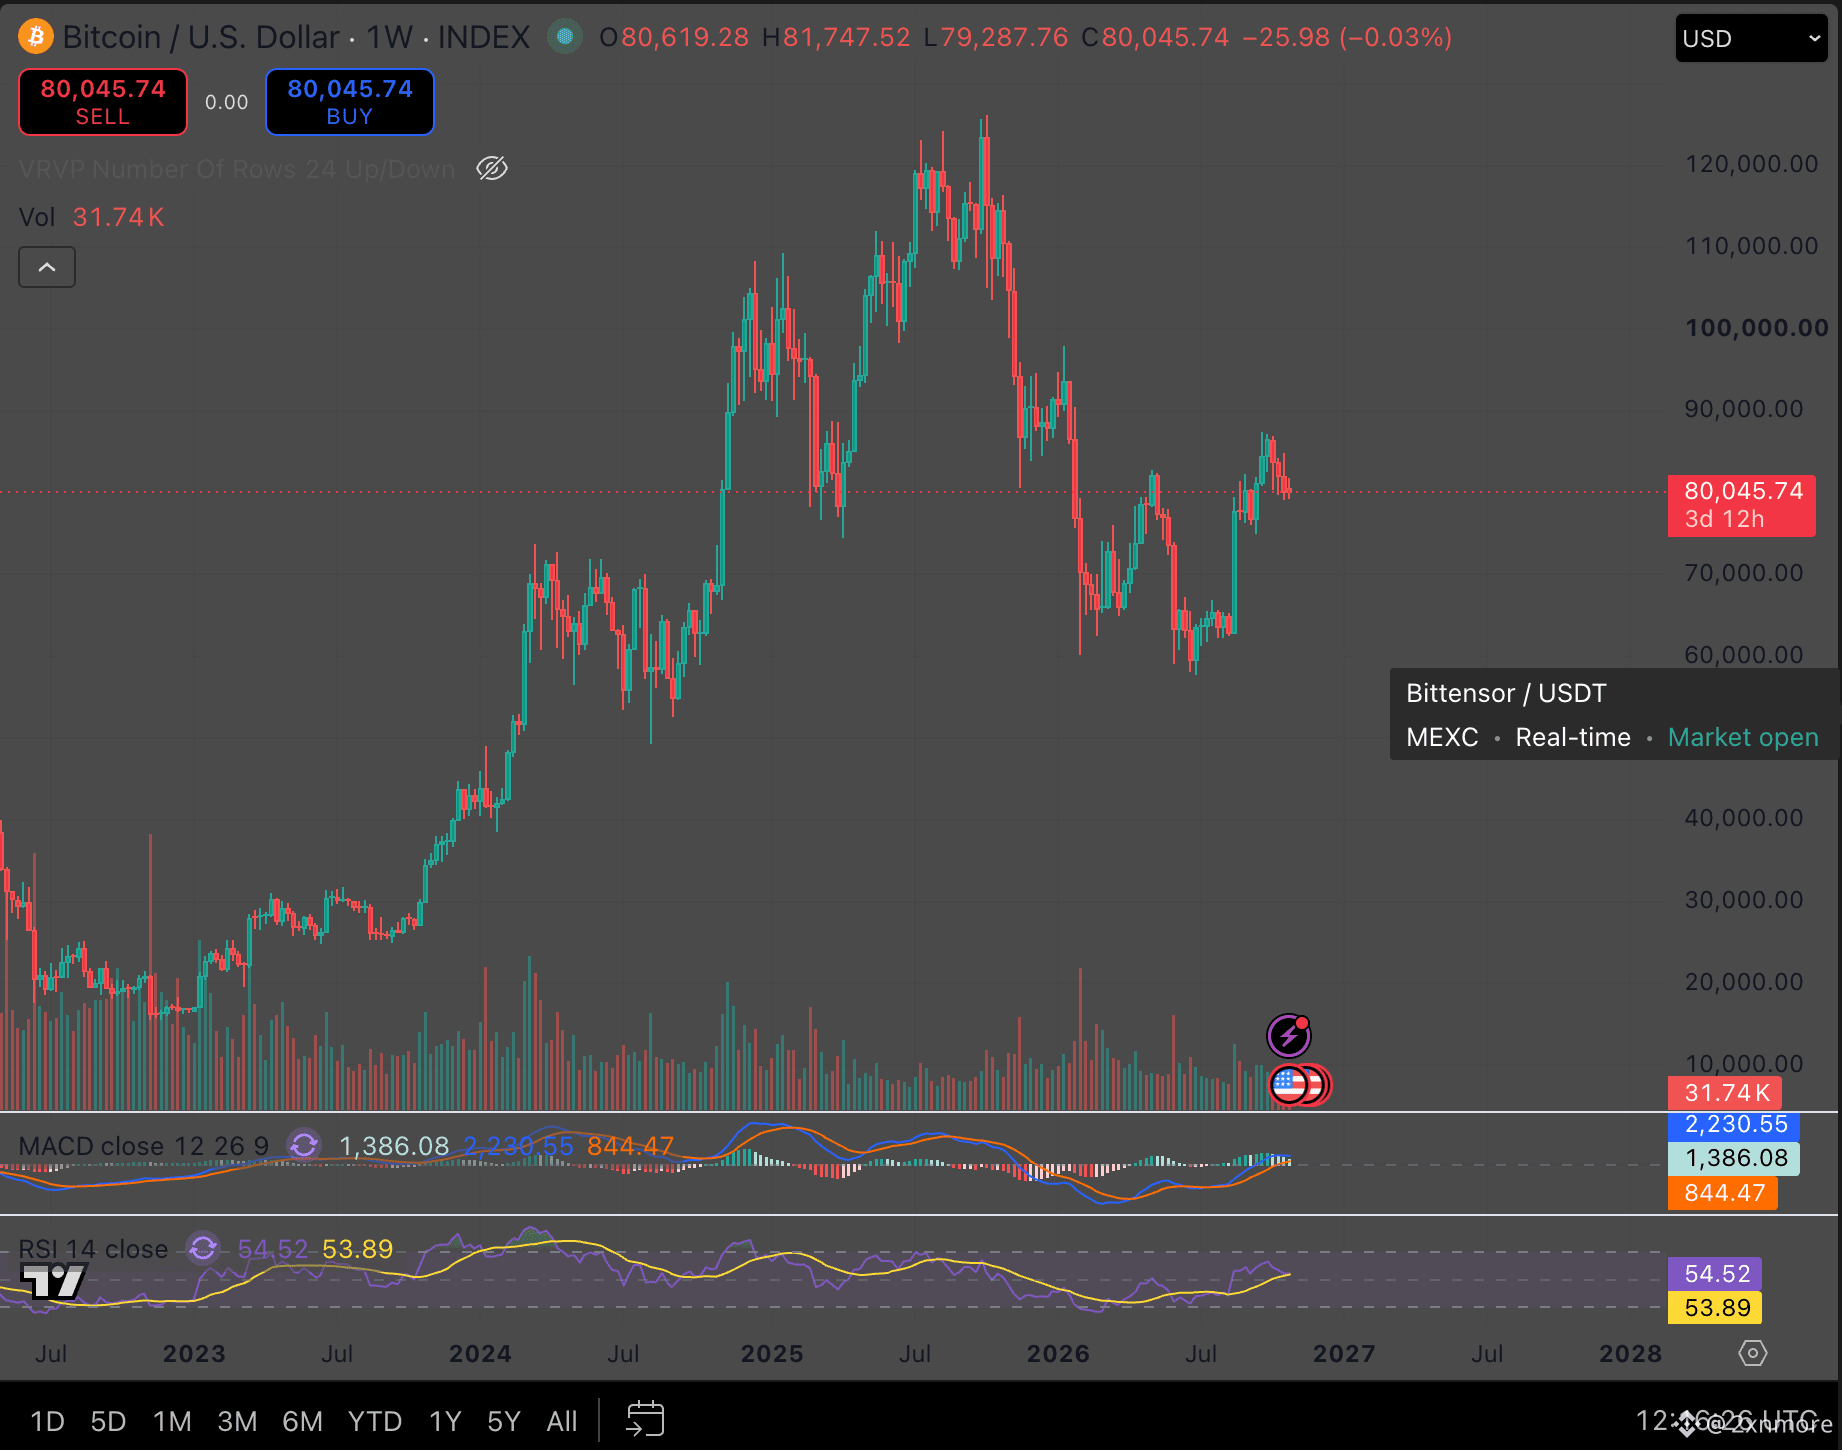
Bitcoin is flat this week, and the timeline is bored. The weekly chart is the opposite of boring.
$BTC weekly, zoomed out.
After the $126K top, price fell into two lows six months apart.
Around $60K in February.
Around $58K in summer.
That is a double bottom forming over half a year.
The neckline of that pattern sits near $82K, the spring high. In September, price broke above it and ran to roughly $88K.
Now it is back at $80K, retesting that neckline from above.
The momentum picture has flipped.
• Weekly MACD is above its signal line and both are back above zero for the first time since the breakdown
• Weekly RSI sits near 54.5, back above 50 and above its own average
Neither is overheated. There is room to run if buyers show up.
Now the math most people skip.
Neckline near $82K minus the low near $58K is about $24K. Add that to the neckline and the textbook target lands near $106K.
That is a projection, not a promise. Patterns fail all the time.
The map from here:
• Hold $78K to $80K on a weekly close: the retest holds, and $88K is next
• Reclaim $88K: the pattern is confirmed, and $97K comes into view
• Lose $75K on a weekly close: the breakout fails, and the $58K to $60K floor is back in play
The daily chart shows a pullback. The weekly chart shows a base that took six months to build.
Which one are you trading?