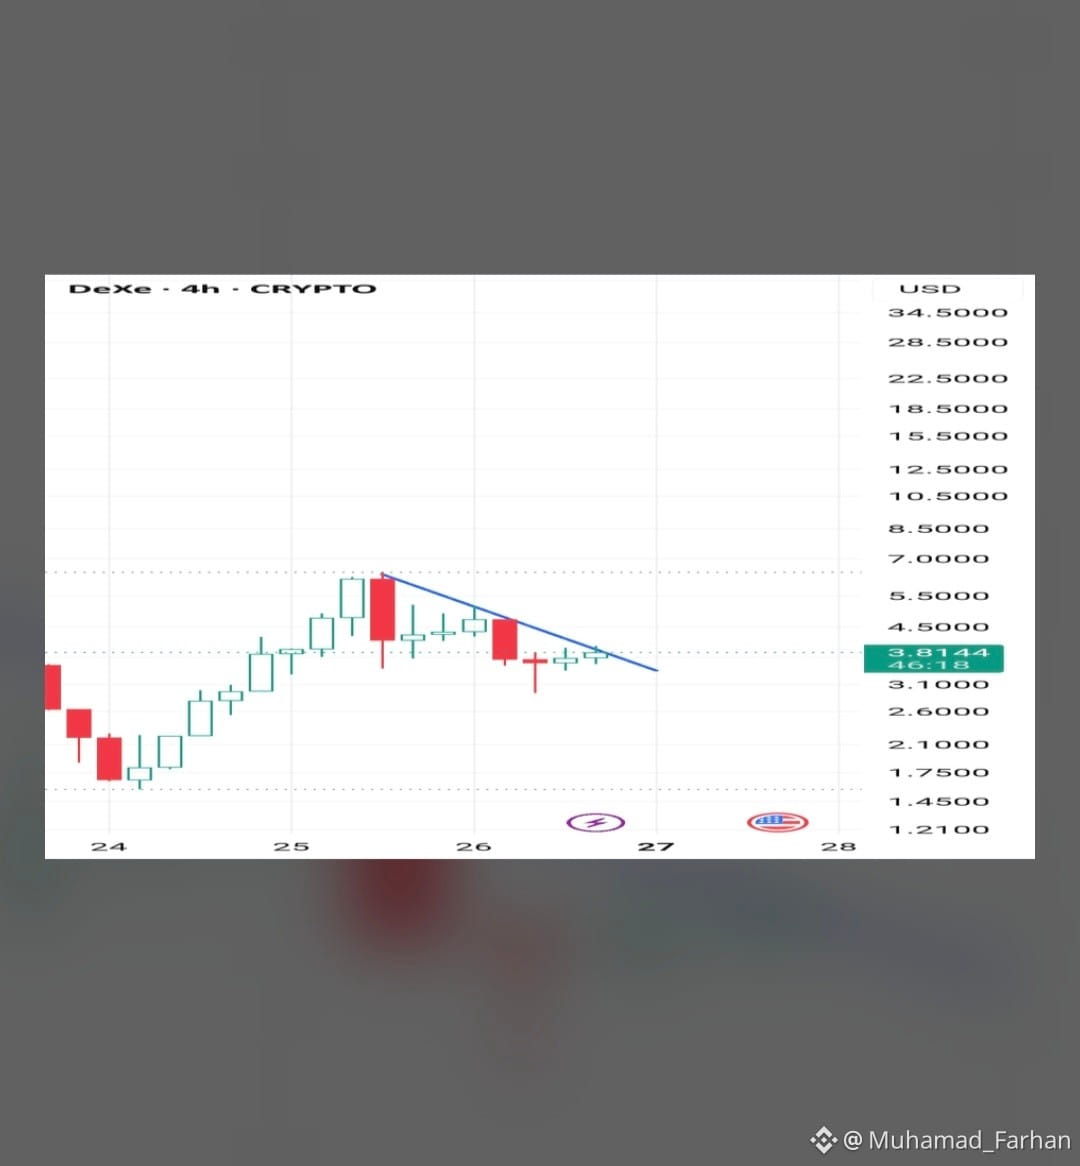
$DEXE $BTC $SAGA Technical Analysis: DeXe ($DEXE )
DeXe ($DEXE ) is consolidating following a period of macro correction from earlier mid-year highs. The short-to-medium term structural outline and key technical levels show clear zones to monitor:
Key Technical Levels
Primary Resistance Zone ($1.80 – $2.00):
The $1.81 to $1.85 region aligns with the short-term Exponential Moving Averages (12/26 EMA).
A sustained breakout and daily candle close above $2.00 would signal a structural trend reversal and open targets toward higher resistance near $2.35–$2.80.
Immediate Support Zone ($1.55 – $1.60):
The $1.55 – $1.60 range serves as crucial demand support. Holding above this level maintains short-term base stability.
A breakdown below $1.55 risks tests of lower support near $1.35 – $1.20.
Momentum & Indicators Breakdown
RSI (14-period): Floating around 30 – 37, signalling oversold to neutral-bearish conditions. It indicates limited sell-side momentum expansion, though buyer volume is still required for a clear push up.
Moving Averages (EMA / SMA): Price remains below key moving averages, including the 50-day and 200-day SMAs, keeping broader structural bias strictly neutral-to-bearish until $2.00 is reclaimed.
MACD: Signals a slight bearish cross, pointing to short-term accumulation rather than immediate momentum expansion.
Trading Scenarios
Bullish Setup: Look for a high-volume breakout and confirmation close above $1.85 – $2.00. Target extensions lie at $2.35 and $2.80.
Bearish Setup: A breakdown below $1.55 opens downside risk toward $1.35, where historical demand previously activated.
#FedWatch #EarningsSeason #CanMicrosoftDeliverOnAI #CanGoogleDefindItsCore #BitcoinCoreIdentifiesThreeVulnerabilities