$BMT Price Prediction Today: Bubblemaps Crypto Signal & Technical Analysis 📊
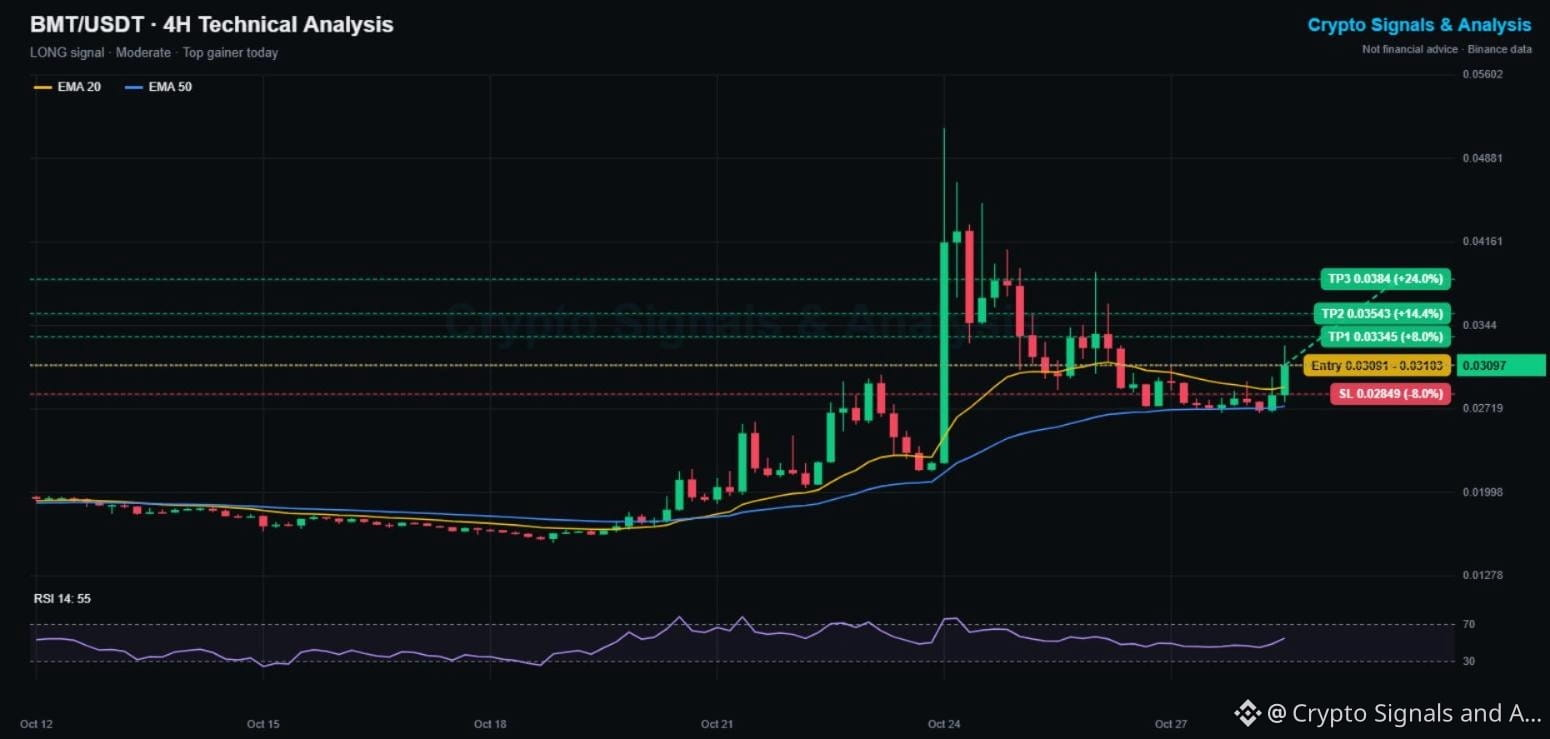
🟢 LONG | Entry 0.03091 - 0.03103 | TP1 0.03345 | SL 0.02849
👉 Tap $BMT to place your trade fast
Bubblemaps is one of today's top gainers, up 14% in 24 hours and 40% in a week. After a wild spike to 0.051 on Oct 24, it cooled off for 4 days, held its rising 4H EMA50, and is now breaking higher again.
📌 BUBBLEMAPS TRADING SIGNAL (Moderate, high volatility)
Entry: 0.03091 - 0.03103
Take profit 1: 0.03345 (+8%)
Take profit 2: 0.03543 (+14%)
Take profit 3: 0.03840 (+24%)
Stop loss: 0.02849 (-8%)
📊 BMT TECHNICAL ANALYSIS (4H CHART)
The pullback ended exactly on the EMA50 (0.0274), and the latest big green candle has reclaimed the EMA20 (0.0291). RSI turned up from 45 to 55. The 0.033 to 0.034 zone was the post-spike range, and above it the next stop is the 0.039 high.
🔑 KEY LEVELS
Support: 0.0291 (EMA20), then 0.0274 (EMA50)
Resistance: 0.0335, then 0.0390
📈 Bullish scenario: a 4H close above 0.0335 opens TP2 and TP3.
📉 Bearish scenario: losing the EMA50 again means the momentum is gone. A close under 0.02849 cancels this signal.
💡 Bottom line: this is a small-cap coin with big swings. Trade small and take profit fast.
👉 Tap $BMT
to open the live chart. NFA
🔥 TRADE WITH LOWER FEES
✅ Get a 20% kickback on your Binance trading fees, for life
👇👇👇
Claim your 20% Binance fee kickback here
━━━━━━━━━━
Is Bubblemaps heading back to the 0.05 spike high? 👇
Follow Crypto Signals and Analysis for daily signals.
#cryptosignals #BMT #EarningsSeason
⚠️ Crypto is volatile: risk only what you can afford to lose.