$SUI Price Prediction Today: Sui Crypto Signal & Technical Analysis 📊
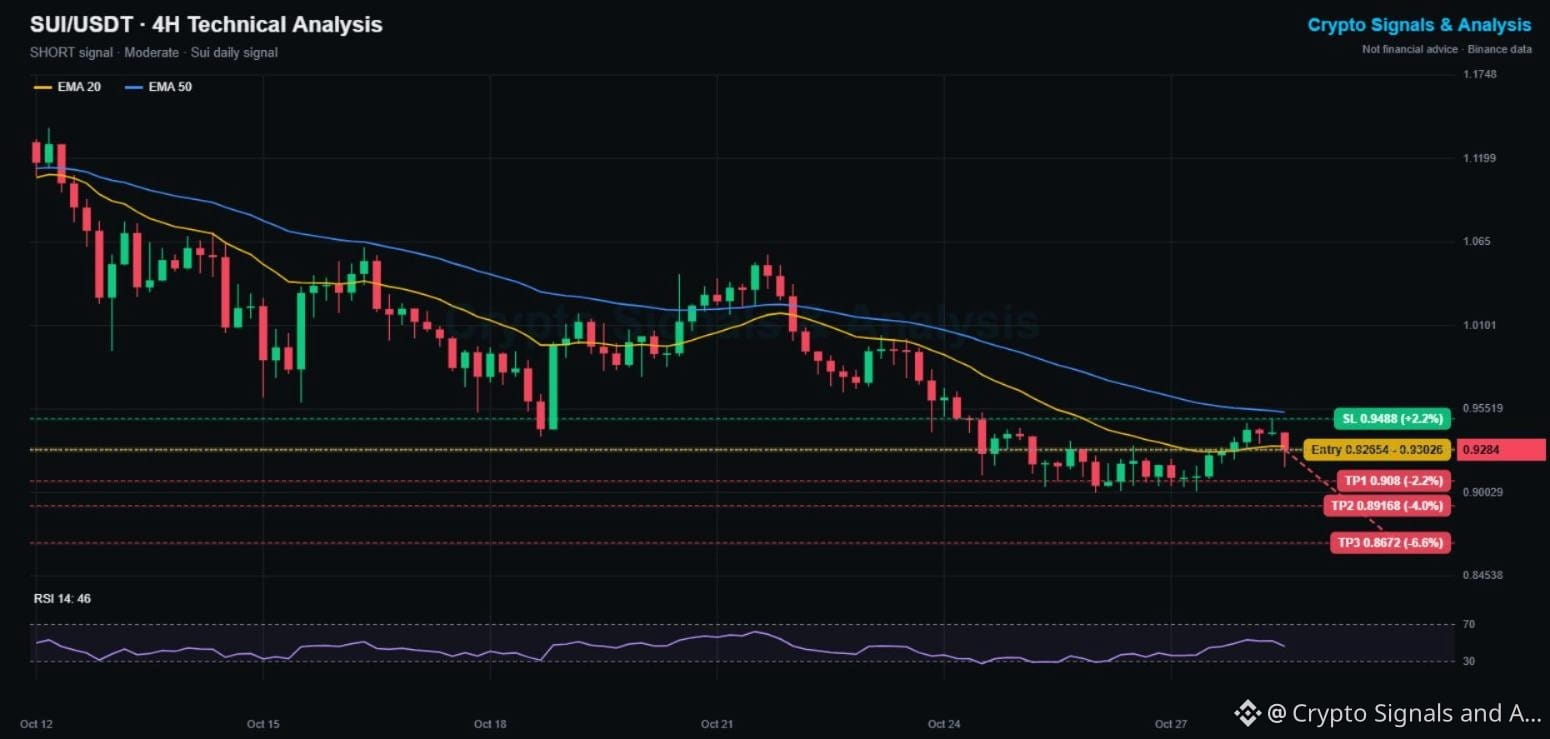
🔴 SHORT | Entry 0.9265 - 0.9303 | TP1 0.9080 | SL 0.9488
👉 Tap $SUI to place your trade fast
Sui is down almost 12% this week and trades under 1.00 for the first time in months. Its relief bounce stalled at 0.948, just under the falling 4H EMA50, and a red candle is now pushing it back down.
📌 SUI TRADING SIGNAL (Moderate, 3/5 signals agree)
Entry: 0.9265 - 0.9303
Take profit 1: 0.9080 (-2.2%)
Take profit 2: 0.8917 (-4.0%)
Take profit 3: 0.8672 (-6.6%)
Stop loss: 0.9488 (+2.2%)
📊 SUI TECHNICAL ANALYSIS (4H CHART)
SUI fell from 1.14 to 0.90 since Oct 12 in a clean staircase of lower highs. Price is back under the EMA20 (0.9307), and the EMA50 (0.9530) caps everything above. RSI at 46 is neutral, tilting down. The 0.90 floor has held 3 times, and a 4th test could break it.
🔑 KEY LEVELS
Support: 0.9001, then 0.8672
Resistance: 0.9307 (EMA20), then 0.9484 to 0.9530
📈 Bullish scenario: a 4H close above 0.9488 and the EMA50 would end the downtrend and cancel the short.
📉 Bearish scenario: a break under 0.90 opens TP2 and TP3.
💡 Bottom line: Sui is still in a downtrend until 0.95 breaks. Take profit near the 0.90 floor in case it holds again.
👉 Tap $SUI
to open the live chart. NFA
🔥 TRADE WITH LOWER FEES
✅ Get a 20% kickback on your Binance trading fees, for life
👇👇👇
Claim your 20% Binance fee kickback here
━━━━━━━━━━
Sui under 0.90 or back above 1.00 first? 👇
Follow Crypto Signals and Analysis for daily signals.
#cryptosignals #SUI #CanGoogleDefendItsCore
⚠️ Crypto is volatile: risk only what you can afford to lose.