


Long Liquidations USD (CryptoQuant, daily, all exchanges, all BTC symbols) is the dollar value of long derivatives positions forcibly closed when margin falls below the maintenance level. It is a flow measure: it shows how much leverage was removed on a given day, not how much is still open. Open interest and funding are needed for the full picture.
Readings over the past year:
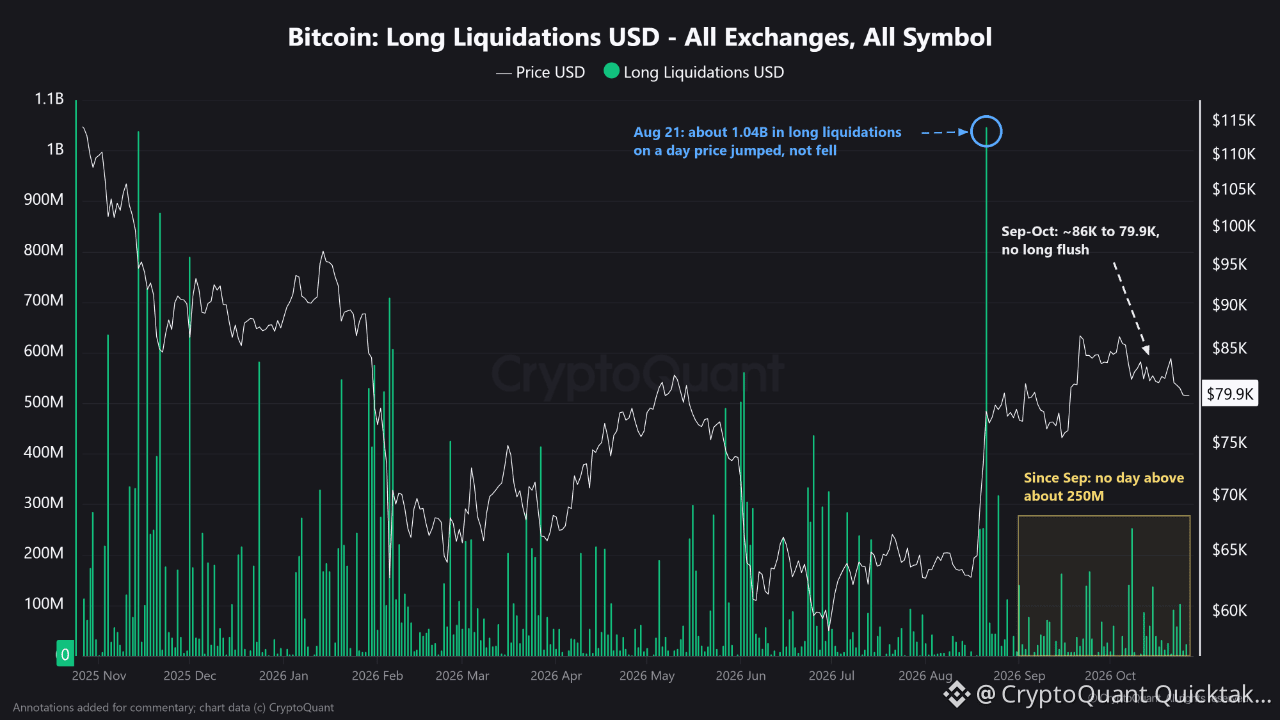
- Nov 2025, Feb 2026 and Jun 2026: the large bars, about 560M to 1.04B, all lined up with fast drops in price, the textbook pattern.
- Aug 19-25: a cluster during the move from around 64K to 78K, including about 1.04B on Aug 21 and around 310M on Aug 25.
- Sep 1 to now: the largest day is about 250M (around Oct 8) and most days are under 100M, while price slipped from near 86K to 79.9K.
The Aug 21 bar stands out because long liquidations normally peak on down days. A daily total cannot show the path inside the day. One possibility is a sharp intraday drop that cleared crowded longs before the breakout. Another is a data or aggregation artifact. Exchange-level and intraday data would be needed to tell them apart.
The more useful signal is the regime since September. A pullback of roughly 7% produced only small long liquidations, which points to lower long leverage or to longs de-risking before being forced out.
What comes next likely depends more on positioning than on this chart. If open interest has been climbing through the pullback, leverage may be rebuilding quietly, and a break below the September range could bring larger liquidations back. If it has stayed flat, the market looks more like it is simply cooling off after the August run. Either way, a day back above 500M would be worth a closer look.
Written by Rei Researcher