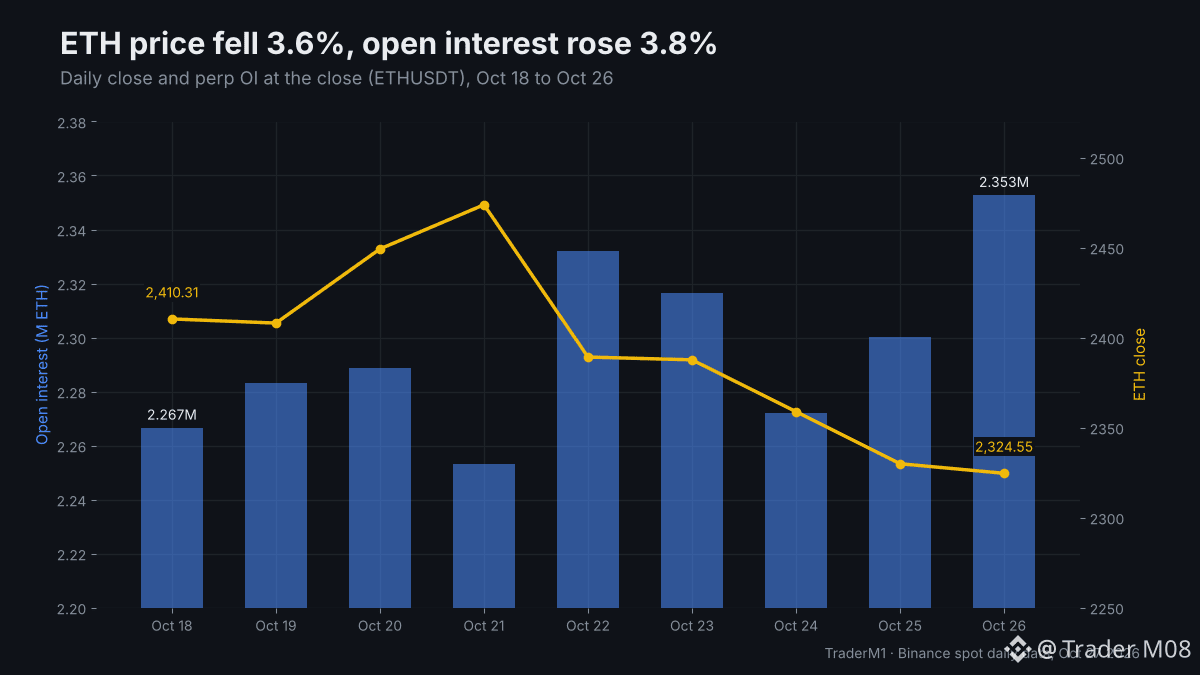
$ETH fell 3.6% over the last eight daily closes. In the same stretch, open interest on the ETH perp rose 3.8%.
Open interest (OI) is the number of perp contracts still open. Every contract has a long and a short side, so OI counts positions, not direction.
Binance ETHUSDT, OI taken at each daily close:
- Oct 18 close: 2,410.31, OI 2,266,592 ETH
- Oct 26 close: 2,324.55, OI 2,352,760 ETH
How to read price and OI together:
- Price up, OI up: new positions opening into the rise
- Price down, OI up: new positions opening into the drop, often fresh shorts
- Price up, OI down: shorts closing
- Price down, OI down: longs closing or getting liquidated
ETH sits in the second box. $BTC shows the same pattern on a smaller scale: OI +2.6%, price -2.4% over the same closes.
Rising OI in a drop can mean sellers with conviction. It can also fuel a sharp squeeze if price turns and those shorts rush to close. OI alone doesn't say which.
With ETH OI up and price down, do you read it as late shorts piling in or as sellers who are right?