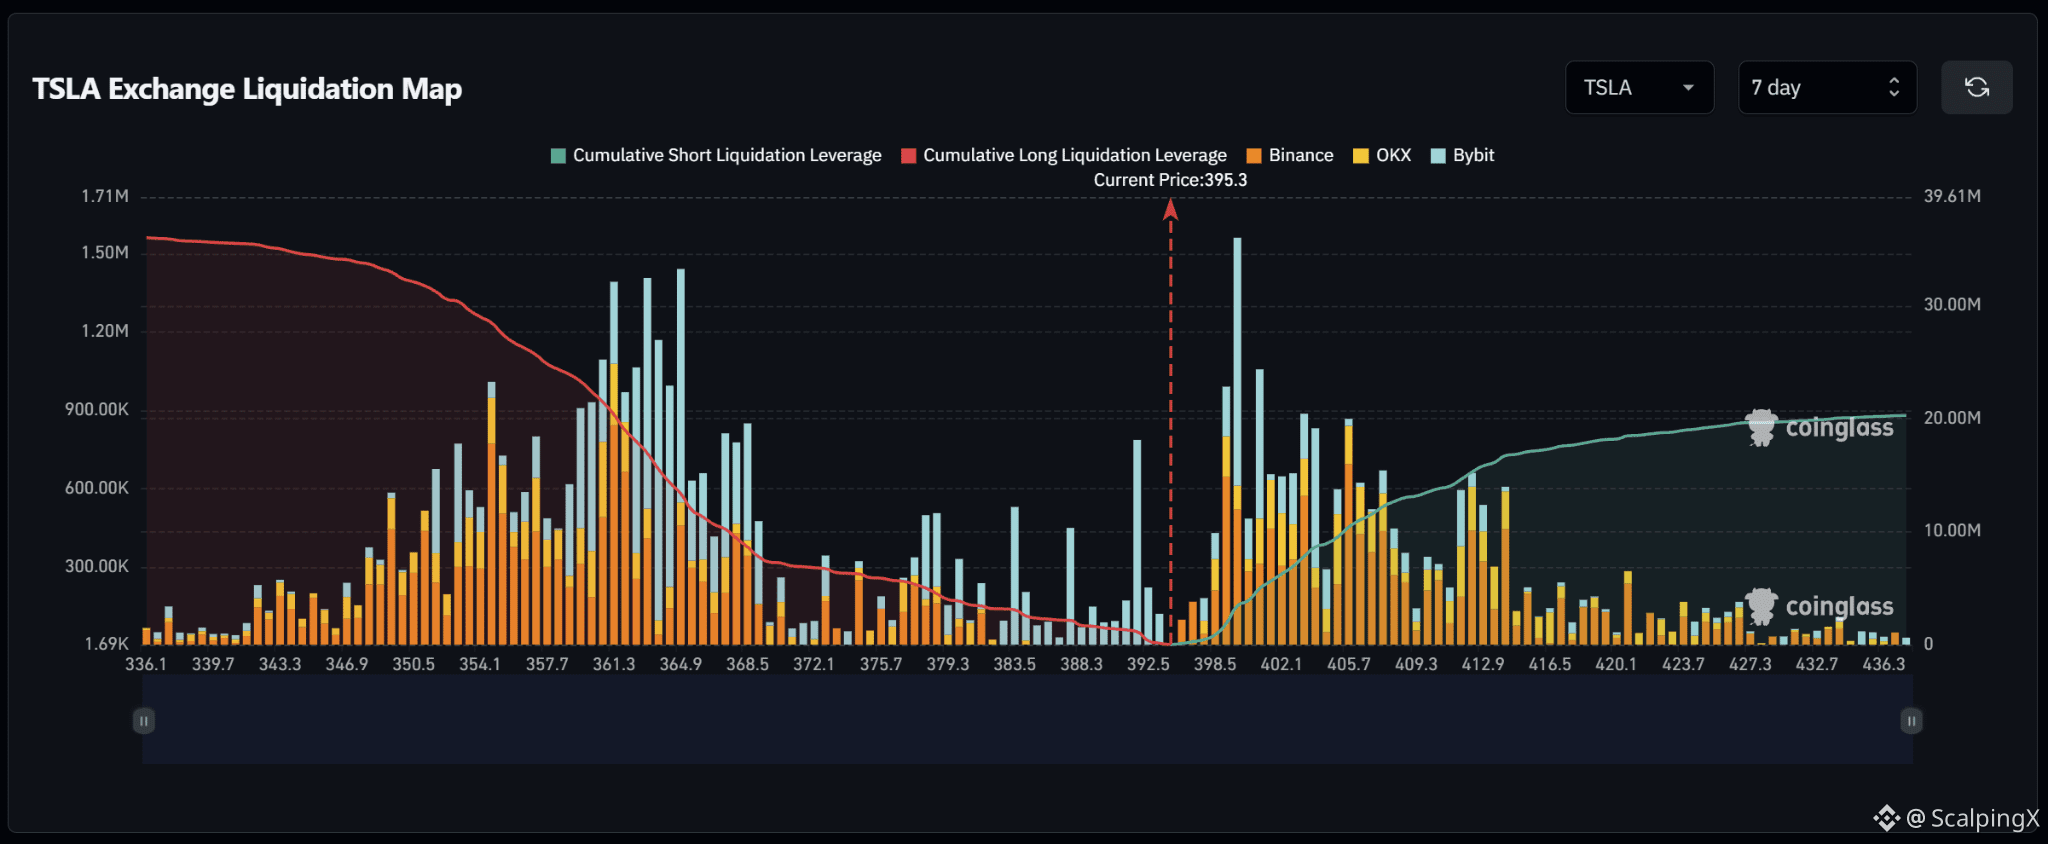
$TSLA – Liquidation Map (7 days) – Index ~395.3
🧭 TSLA favors an upside short sweep first. Although cumulative long liquidations are larger, their heaviest concentration sits farther away at 350–369. The short cluster at 398.5–403.5 is closer, with a prominent liquidation spike near 400.
🔺 The first target is 398.5–403.5. Short liquidations could amplify the advance as price approaches 400. Holding above 403.5 opens the next target at 405–408.5.
🎯 A break and hold above 408.5 shifts attention to 412–414. Liquidation density drops noticeably beyond this zone, reducing further squeeze fuel. The reaction there matters more than chasing the move.
⚖️ The upside scenario uses 392.5 as its key reference. Losing it without a reclaim shifts priority to 388–390, then 378–384. A sweep near 400 followed by a drop below 398.5 would also weaken the case for further upside.
#LiquidationMap