


Hmm I mean actually.....
Sometimes, the most important market signal is not a sudden crash. It is the moment when a trend that looked stable starts losing the strength that kept it moving.
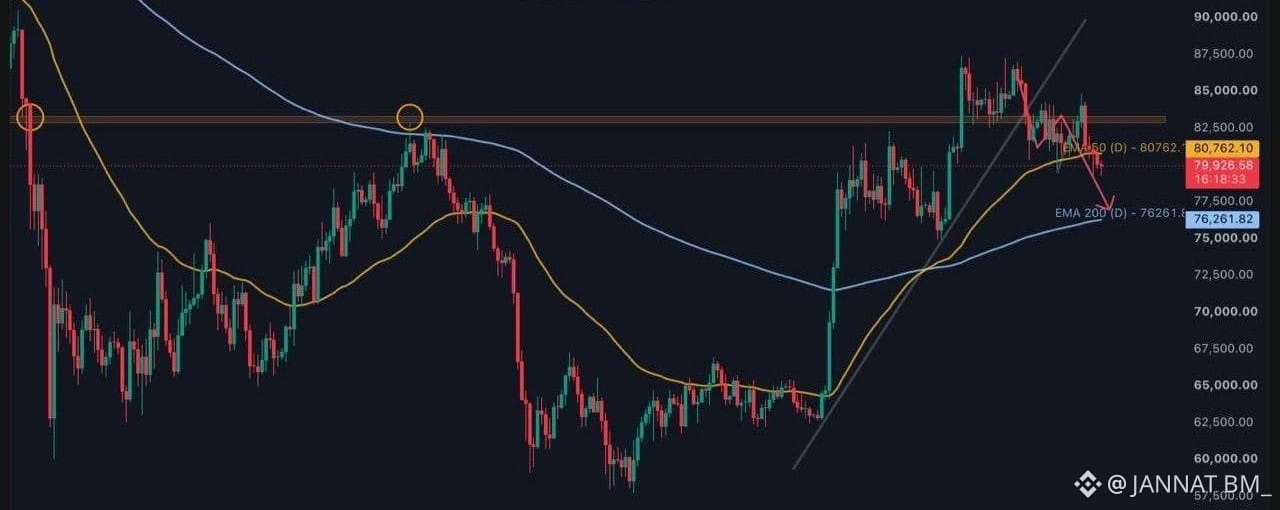
Bitcoin losing its 50-day EMA is worth paying attention to for that reason. It does not automatically confirm a deeper correction, but it does raise a question that traders cannot ignore: what happens if the next major support fails to hold?
Markets rarely move in isolation. Price action reflects a mix of investor expectations, liquidity, macroeconomic conditions, and confidence in what comes next. When several of these factors become uncertain at the same time, even a market with a strong long-term narrative can struggle to maintain its momentum.
That is where Bitcoin stands in this analysis.
The loss of the 50-day EMA suggests that short-term bullish momentum has weakened. The next level attracting attention is the 200-day EMA, currently around $76K. A move toward this area would put a more important support zone under pressure. But the interesting part is not simply the possibility of Bitcoin falling. It is the number of uncertainties surrounding the market right now. Geopolitical tensions can change risk appetite quickly. Elections introduce another layer of uncertainty, while macroeconomic conditions influence how investors approach assets such as Bitcoin. None of these factors guarantees a decline, but together they can make traders more cautious about committing fresh capital. And when confidence becomes fragile, technical levels start carrying more weight. There is also the broader four-year cycle argument. The current analysis points to a potential bear-market window lasting more than a year, with mid-November marking an important point in that timeline. Some market participants may use this framework to anticipate further downside before a possible recovery later in the cycle.
Still, historical cycles are reference points, not fixed schedules. Bitcoin does not have to repeat its previous behavior exactly, and a calendar date alone cannot confirm where the market will turn. The more practical question is whether buyers can defend the current local bottom. If they fail, a deeper correction becomes a possibility. Even if Bitcoin avoids a breakdown below the 200-day EMA, another test of the $69K region could put pressure on traders who expected the recovery to continue without further setbacks. That level matters in this scenario because it represents a potential retest before a new uptrend develops. The outlook presented here anticipates that a more sustainable recovery could begin in late December, but that remains a market hypothesis rather than a confirmed outcome.
I think the distinction between a temporary bounce and a genuine trend reversal deserves more attention.
A bounce can happen because sellers become exhausted or short positions close. A lasting uptrend requires something more convincing: buyers willing to defend higher lows, stronger follow-through after resistance breaks, and enough demand to prevent every recovery from turning into another selling opportunity.
Until those signs appear, treating every green candle as confirmation of a new bull run could be premature.
On the other hand, assuming that losing one moving average guarantees a prolonged bear market would be equally simplistic. Markets often recover from technically weak positions when expectations become too pessimistic or fresh demand enters.
For traders, that means watching how Bitcoin reacts around $76K and whether the $69K region comes back into play may be more useful than trying to predict every move in advance.
The late-December recovery thesis is worth monitoring, but the market still has to establish the conditions that would support it.
If Bitcoin revisits $69K before recovering, will that be the final shakeout before a new uptrend, or a warning that the market has further to fall?
Let's see.... 🤔
