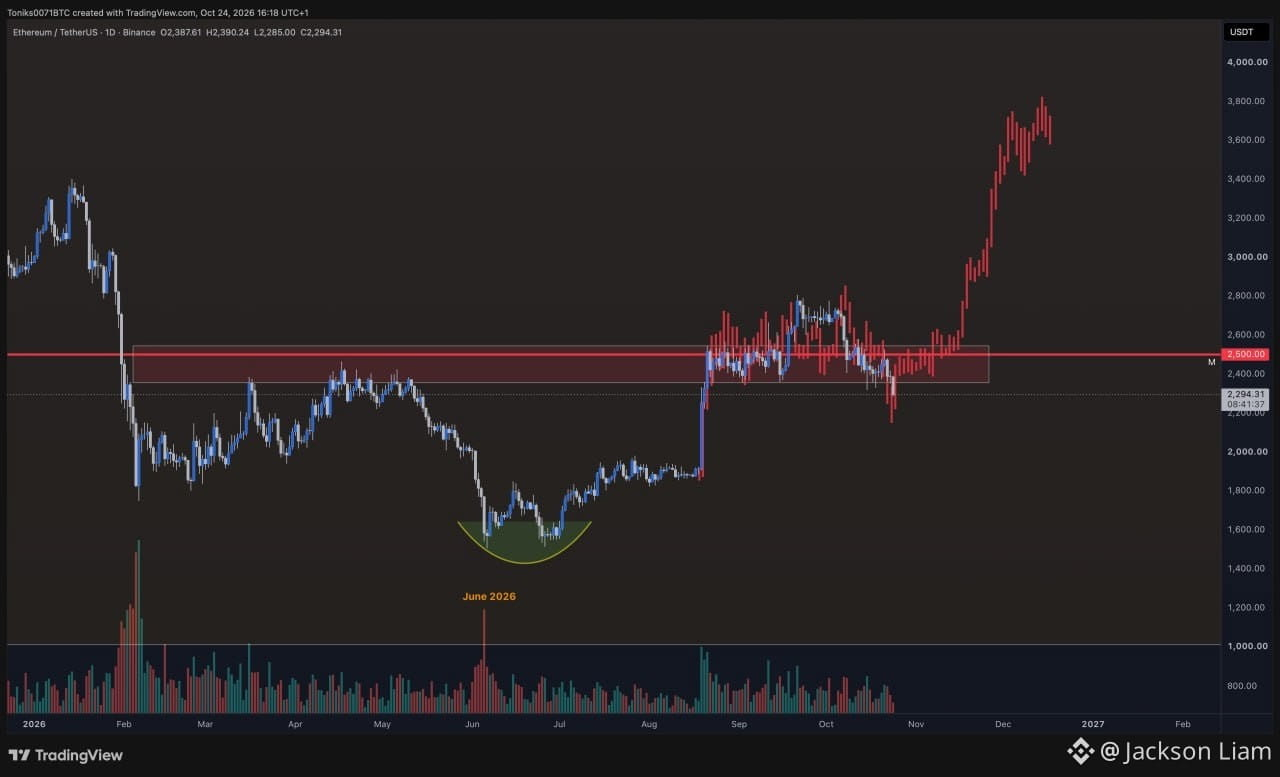

$ETH on the 1D timeframe, with a major breakout structure around the $2,500 area.
What the chart is showing
$2,500 is the key historical resistance/support zone. ETH spent a long period consolidating around roughly $2,350–$2,600 before breaking out.
The June 2026 rounded-bottom structure around $1,500–$1,900 suggests a larger accumulation phase.
ETH then pushed strongly through the $2,500 resistance, followed by consolidation/retesting.
The subsequent rally toward $3,600–$3,800 indicates that the breakout was significant.
The current candles at the right side show consolidation near the highs, rather than an obvious breakdown.
The important level
The red horizontal line at $2,500 is the major level to watch.
If ETH were to revisit it and hold above it, the chart would essentially be showing:
Accumulation → breakout → retest → continuation
That would make $2,500 a potentially important long-term support zone.
If ETH loses the broader $2,350–$2,400 area, however, the breakout structure would become much less convincing.
My read
The higher-timeframe structure is bullish, but the chart is already substantially extended from the breakout zone. I wouldn't interpret the move as “ETH must keep going straight up.” After a move from ~$2,500 toward ~$3,700+, a period of consolidation or pullback would be completely normal.
The cleanest bullish confirmation would be a successful hold above the breakout zone followed by a new higher high.
#ETH #BinancePick #EarningsSeason #SouthKoreaDelaysCryptoIncomeTax #DowDrops653Points