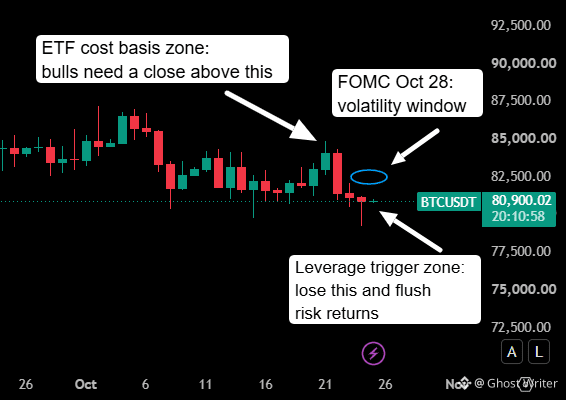
$BTC at 80.9k and the chart is setting a trap for both sides.
A few weeks ago the loud narrative was “bottom is 40-50k.” Now the same crowd is adding longs with 94k targets. Same market, opposite conviction, one month apart. That is CT in one sentence.
I’m not interested in either prediction. Here’s the map I’m watching instead:
Daily close above ~84.4k (the ETF cohort cost basis): interesting, but only if funding stays under ~5% annualized and ETF inflows follow. A close there with funding near 9% is a leveraged move, and those get sold.
Below ~79.8k: leverage has been rebuilt after the two flushes earlier this month, so a third one is a real risk. Funding sits around 7% annualized right now, not crowded, but longs are stacking again.
ETF flows aren’t giving bulls a clean signal either. Friday printed -$137.9M with IBIT leading, while the week is still net positive. Mixed flows = no conviction.
FOMC on Oct 28 is the volatility window. Price can sweep both sides in one candle.
This changes the probability, not the thesis: range-bound until spot demand proves otherwise.
Predictions are cheap. Levels, scenarios and invalidation points are what keep you alive.
Verify first. risk later. scale slowly...
#DowDrops653Points
#btc
#EarningsSeason