

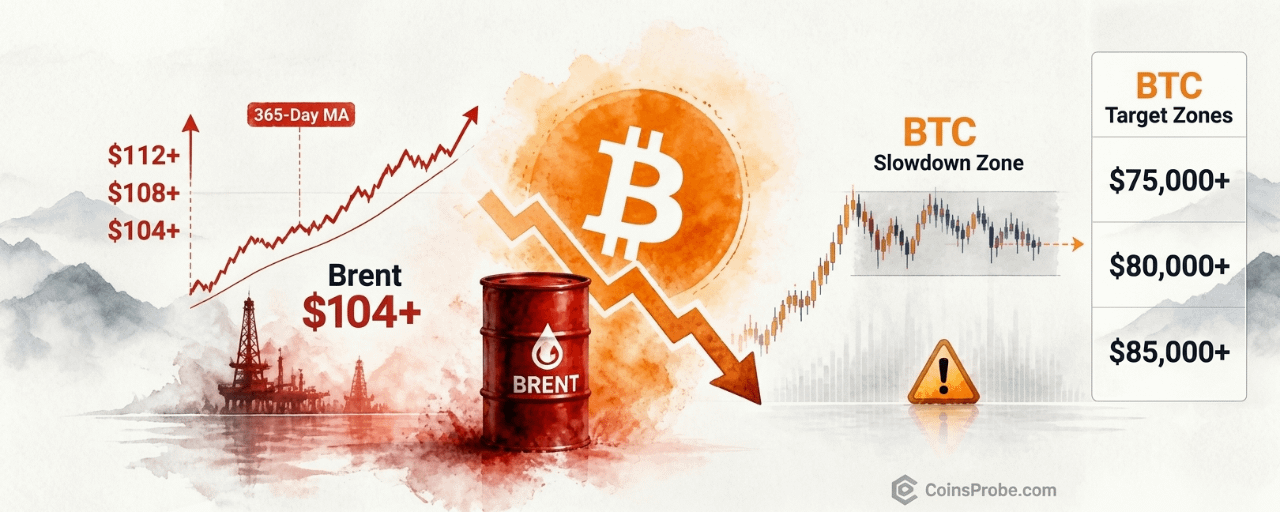


Key Highlights
Bitcoin trades at $81,524 (-0.72% 24h) as Brent crude holds above $100, above its 365-day moving average
CryptoQuant analyst @Darkfost_Coc: "When Brent settles into a strong upward trend, above its annual average, Bitcoin has often slowed down"
The headwind condition clears only when Brent sustains a move back below its 365-day moving average — not yet the case
Bitcoin is trading at $81,524 — down 0.72% in the past 24 hours — with a market capitalization of approximately $1.64 trillion, as a macro signal that has historically preceded periods of slowed BTC appreciation reasserts itself. Brent crude oil is holding above $100 per barrel, a level that CryptoQuant analyst @Darkfost_Coc identifies as a significant headwind for Bitcoin based on a decade-long correlation pattern.
In a note published via CryptoQuant’s Quicktake platform on October 23, 2026, Darkfost states directly: “Over the long term, we can see that when Brent settles into a strong upward trend, above its annual average, Bitcoin has often slowed down.” The operative condition here is not simply that oil is elevated — it is that Brent is trending above its 365-day moving average in a sustained, directional upward move. That is a structurally different environment from a brief oil spike.
The Signal — Brent Above Its 365-Day Moving Average
The mechanism Darkfost documents is a macro liquidity effect, not a direct Bitcoin correlation. When Brent crude trades in a sustained upward trend above its annual moving average, it signals persistent inflationary pressure in the global energy complex. That environment typically tightens real disposable income, raises input costs across industries, and pressures central banks toward restrictive monetary policy — all of which reduce the marginal appetite for risk assets, including Bitcoin.
The chart shared by @cryptoquant_com plots Bitcoin’s logarithmic price history against Brent crude from approximately 2014 through 2026. The gray shaded bars on the chart mark the periods when this condition — Brent sustaining a trend above its 365-day average — was active. The visual pattern is clear: those shaded periods cluster around Bitcoin consolidation phases and momentum slowdowns, not the explosive vertical legs of BTC bull markets. Brent’s current reading is annotated on the chart at approximately 104.2 on the left axis, placing it above the 365-day average line that is itself now trending upward.
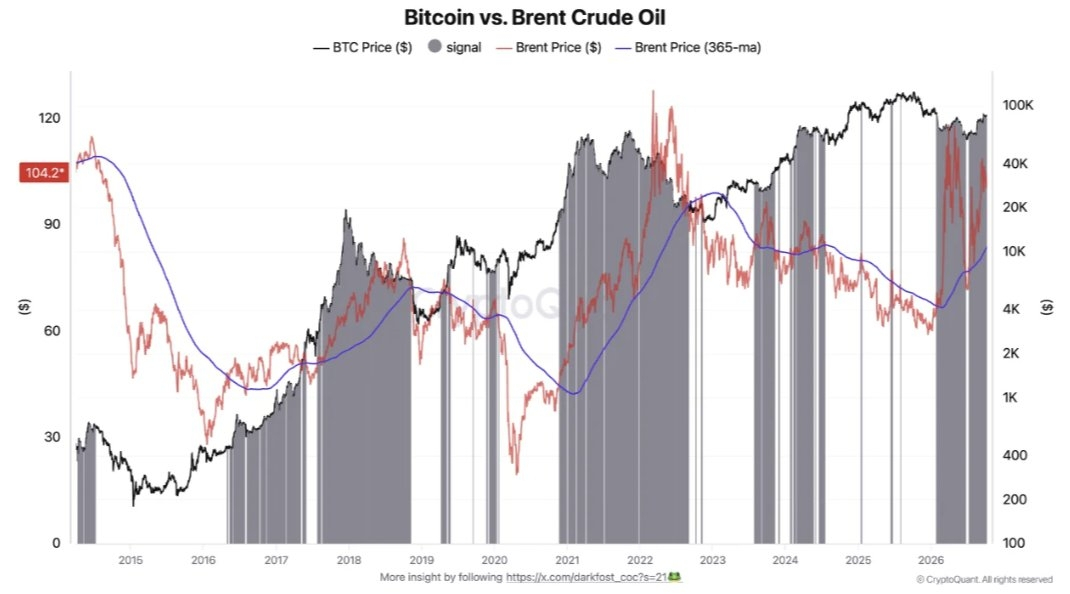
Chart Analysis | Source: @cryptoquant_com (X)
This is not a claim that oil causes Bitcoin to fall. The analyst’s stated finding is more precise: Bitcoin has often slowed down in these environments. The implication for the current moment is a macro friction that does not support a clean continuation of Bitcoin’s prior upward momentum without resolution in the energy complex.
Why This Macro Backdrop Is Structurally Different
There is an important distinction between Brent being elevated and Brent being in a strong upward trend above its annual average. A single oil spike — caused by a geopolitical event, a hurricane, or a brief supply disruption — tends to be self-correcting and does not create the sustained macro drag that Darkfost’s model captures. What the current setup reflects is a durable trend: Brent’s 365-day moving average itself is now curving upward, meaning the benchmark is structurally rising, not just printing a one-time high.
That distinction matters for Bitcoin investors because it determines duration. If Brent were simply elevated on a transient shock, the macro friction would be temporary. A sustained trend above the annual average — the condition the chart specifically identifies — creates a persistent backdrop that has historically coincided with extended BTC consolidation, not a brief pause before resumption.
Bitcoin has not been immune to macro conditions in prior cycles. The long-term holder net position change, which hit +1.27M BTC but is already showing a pace slowdown, reflects a similar dynamic — accumulation exists, but momentum is decelerating at the macro level. Similarly, large-scale whale deposits of 949.7 BTC to Binance and Deribit in recent sessions suggest participants are actively managing exposure rather than adding with conviction.
What the Signal Says — and What It Doesn’t
Darkfost’s observation is directional, not a price target. The analyst does not provide a specific BTC downside level, a price at which Brent crude would stop being a headwind, or a numeric threshold for the oil condition to clear. The finding is explicitly a long-term pattern observation: when the condition is active, Bitcoin has often slowed down. “Often” is the analyst’s word — it is a statistical tendency, not a deterministic rule.
What the signal does not say: it does not predict an imminent Bitcoin collapse, assign a specific percentage drawdown, or establish a timeline. The chart covers over a decade of data, meaning the Brent-above-annual-average condition has appeared across multiple cycle phases, and Bitcoin’s response has varied in magnitude and duration. The consistent pattern is momentum attenuation — not outright reversal in every instance.
What to watch for a change in the macro setup: a sustained move by Brent crude back below its 365-day moving average would remove the headwind condition Darkfost identifies. Until that occurs, the structural macro friction remains active by the analyst’s own criteria.
Bullish Scenario
If Brent crude reverses below its 365-day moving average — removing the headwind condition Darkfost documents — Bitcoin’s historically observed drag from elevated oil prices would dissipate, potentially allowing momentum to resume. Any significant demand shock (demand destruction, OPEC production increase, or geopolitical resolution) that breaks Brent’s upward trend would change the macro backdrop identified in this analysis.
Bearish Scenario
If Brent crude continues trending above $100 and its 365-day moving average continues rising, the sustained headwind condition identified by Darkfost remains intact. Bitcoin at $81,524 would face the same macro friction that the chart shows has historically coincided with extended BTC consolidation periods rather than new all-time high extensions.
The core thesis here is macroeconomic, not technical. Darkfost’s analysis does not establish a Bitcoin price floor or a specific level at which the thesis fails — it documents an environmental condition. Traders watching this signal should track Brent crude’s relationship to its own 365-day moving average as the primary variable, not Bitcoin’s immediate price action. The condition is either active or it is not. At $100+ and trending, it is currently active.
Disclaimer: The views and analysis presented in this article are for informational purposes only and reflect the author’s perspective, not financial advice. Technical patterns and indicators discussed are subject to market volatility and may or may not yield the anticipated results. Investors are advised to exercise caution, conduct independent research, and make decisions aligned with their individual risk tolerance.