


🔥 BTC/USDT: THE BATTLE FOR SURVIVAL HAS BEGUN!
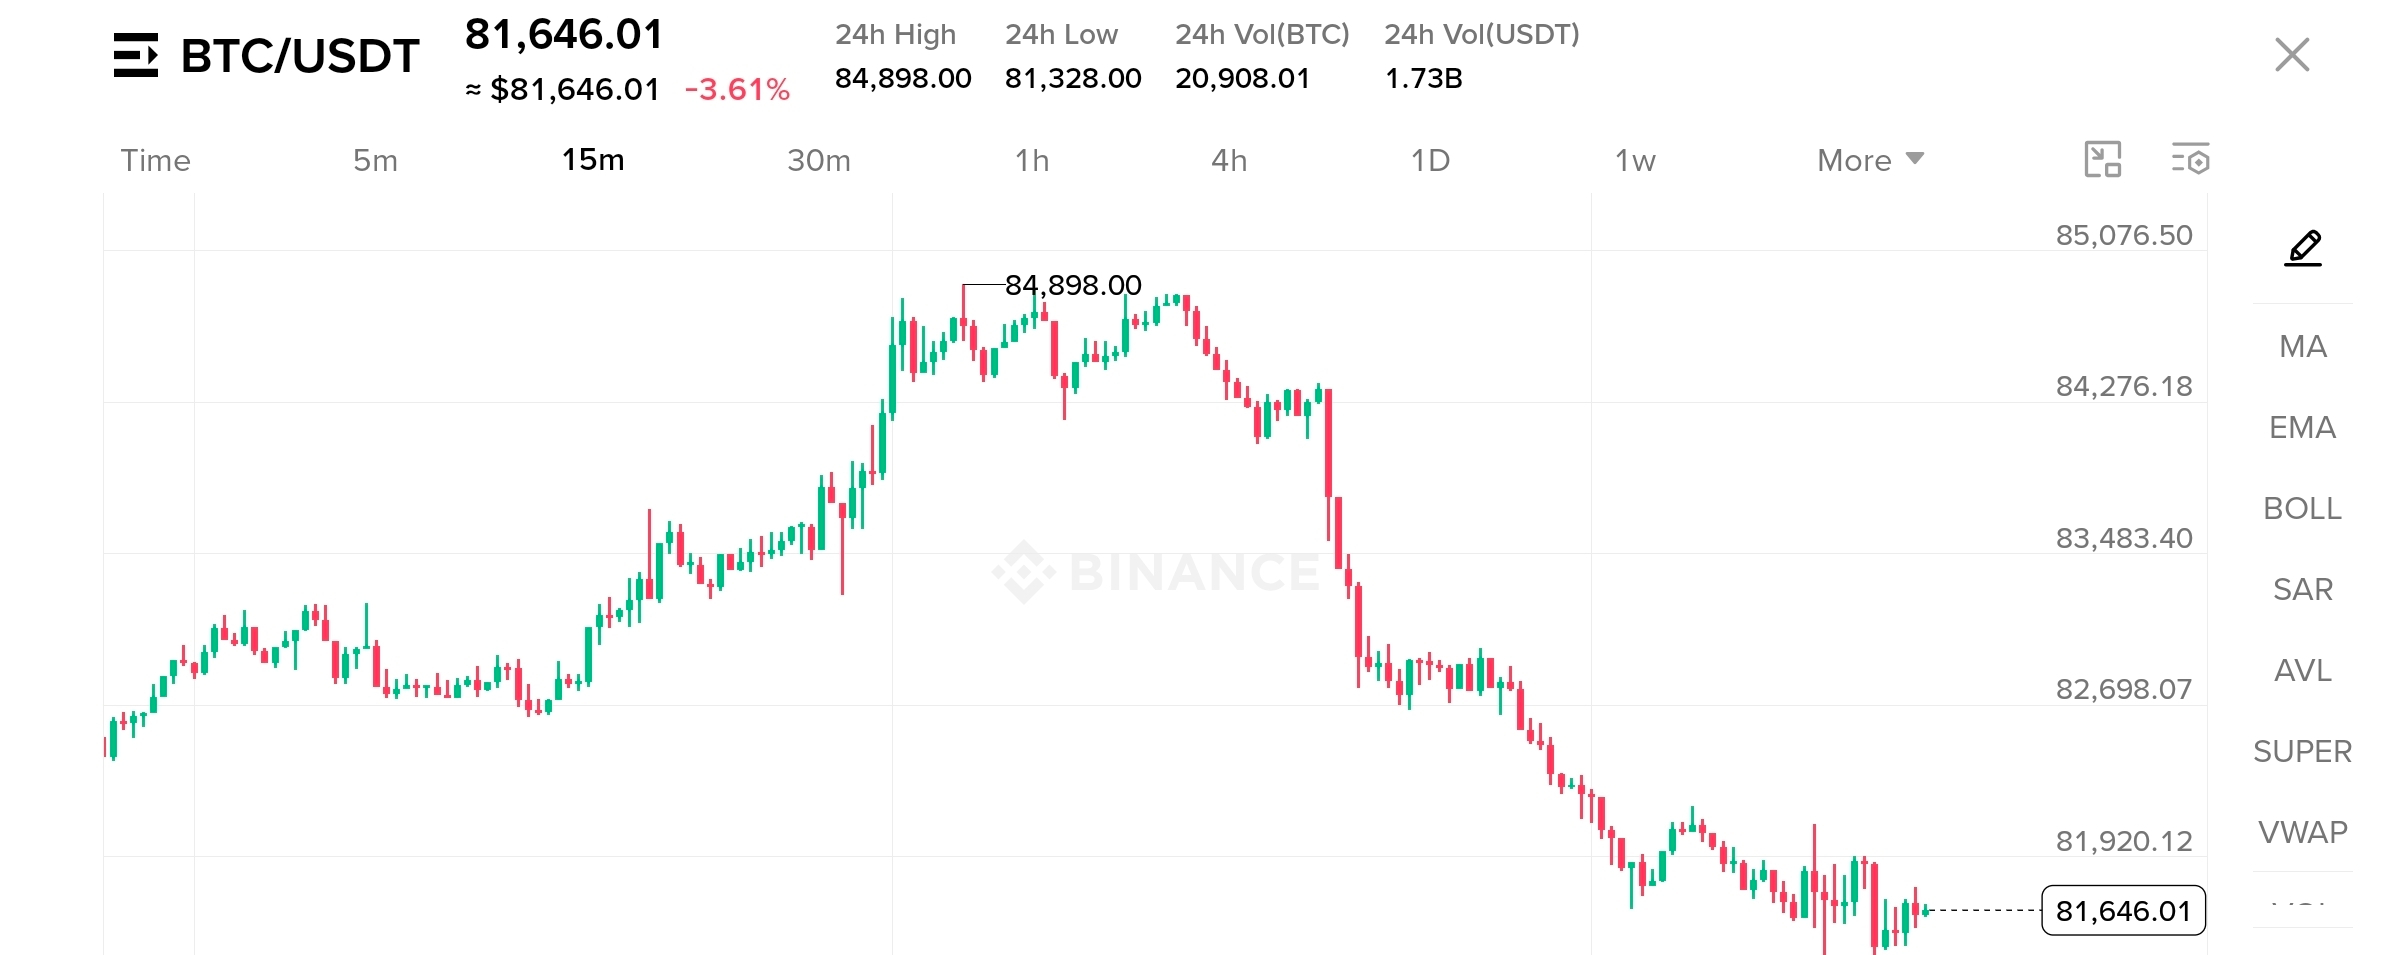
Bitcoin is showing a serious shift in momentum, and the 15-minute chart is telling a story that bulls cannot ignore. After climbing toward $84,898, BTC faced aggressive selling pressure and reversed sharply, wiping out much of its recent upside. Now trading around $81,646, Bitcoin is down approximately 3.61%, and the market is watching one critical question: Is this a temporary shakeout, or is more downside waiting ahead? 📉
🐻 THE BEARS HAVE TAKEN CONTROL — FOR NOW!
The chart shows a clear sequence of lower highs and lower lows following the rejection near $84.9K. The breakdown through the $83.4K and $82.7K areas suggests sellers have gained short-term control. But the real test is happening now, near the recent low of $81,328.
⚔️ THE LEVEL THAT COULD CHANGE EVERYTHING!
If BTC loses $81,328 decisively, with strong selling volume, another wave of downside pressure could emerge. However, if buyers defend this zone and push price back above $81,920, a relief bounce toward $82,700 could become possible. A stronger recovery would still need to reclaim higher resistance levels before the bullish momentum can be trusted again.
🐂 CAN THE BULLS DELIVER A COMEBACK?
Markets often create their biggest opportunities when fear dominates the headlines, but catching a falling knife can be expensive. Watch the reaction around support, monitor volume, and wait for confirmation instead of chasing every candle.
💎 MY TAKE: Bitcoin is at a crucial short-term decision zone. The next move around $81.3K–$81.9K could reveal whether buyers are ready to fight back or sellers still have unfinished business. No direction is guaranteed — let price action confirm the story.
🔥 What do you think comes next?
🐂 $83K+ BOUNCE or 🐻 $80K BREAKDOWN?
Drop your prediction below! 👇
#Bitcoin #technicalJafar #TechnicalAnalysis_Tickeron #TechnicalIndicators $XRP

