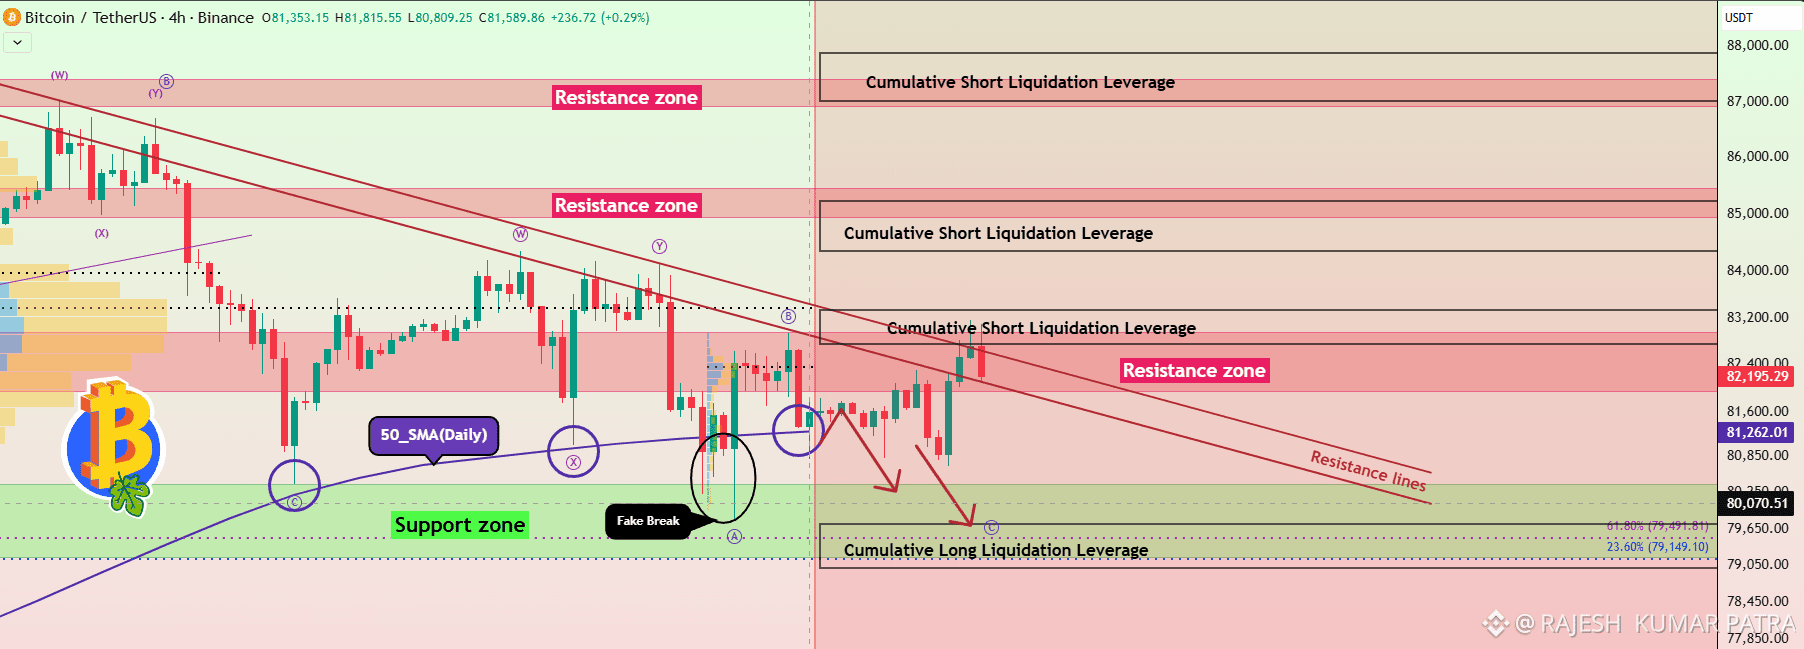
$BTC BTC/USDT 4H Chart Analysis
Based on your chart, BTC is trading around $81,590, approaching a major descending resistance trendline and a marked resistance zone. The setup looks cautiously bearish unless BTC breaks above resistance and holds it.
Current bias
Bearish
Below descending resistance
Key support
$79,150–$80,250
Potential bounce zone
1. Key resistance levels
$82,200–83,200
Immediate resistance
Price is testing the lower descending trendline and the nearby red resistance zone. A rejection here could send BTC back toward support.
$84,900–85,400
Major resistance
A stronger recovery could reach this supply zone, but buyers would need to overcome the nearer resistance first.
$86,900–87,400
Higher resistance
This is a more distant upside target if BTC breaks out of the broader descending structure.
2. Key support and downside targets
$80,250–80,700
First support
This is the upper part of your marked green support area. Watch for a bounce or a clean 4H breakdown.
$79,150–79,650
Major support / liquidity zone
Your chart marks the 23.6% Fibonacci level near $79,149 and the 61.8% level near $79,492. A move into this area could trigger liquidations or a relief bounce.