



Citigroup stock has a neutral daily setup with a defensive bias, despite upbeat third-quarter earnings coverage. Price sits below its 20- and 50-session exponential averages, while the hourly chart offers only partial support.
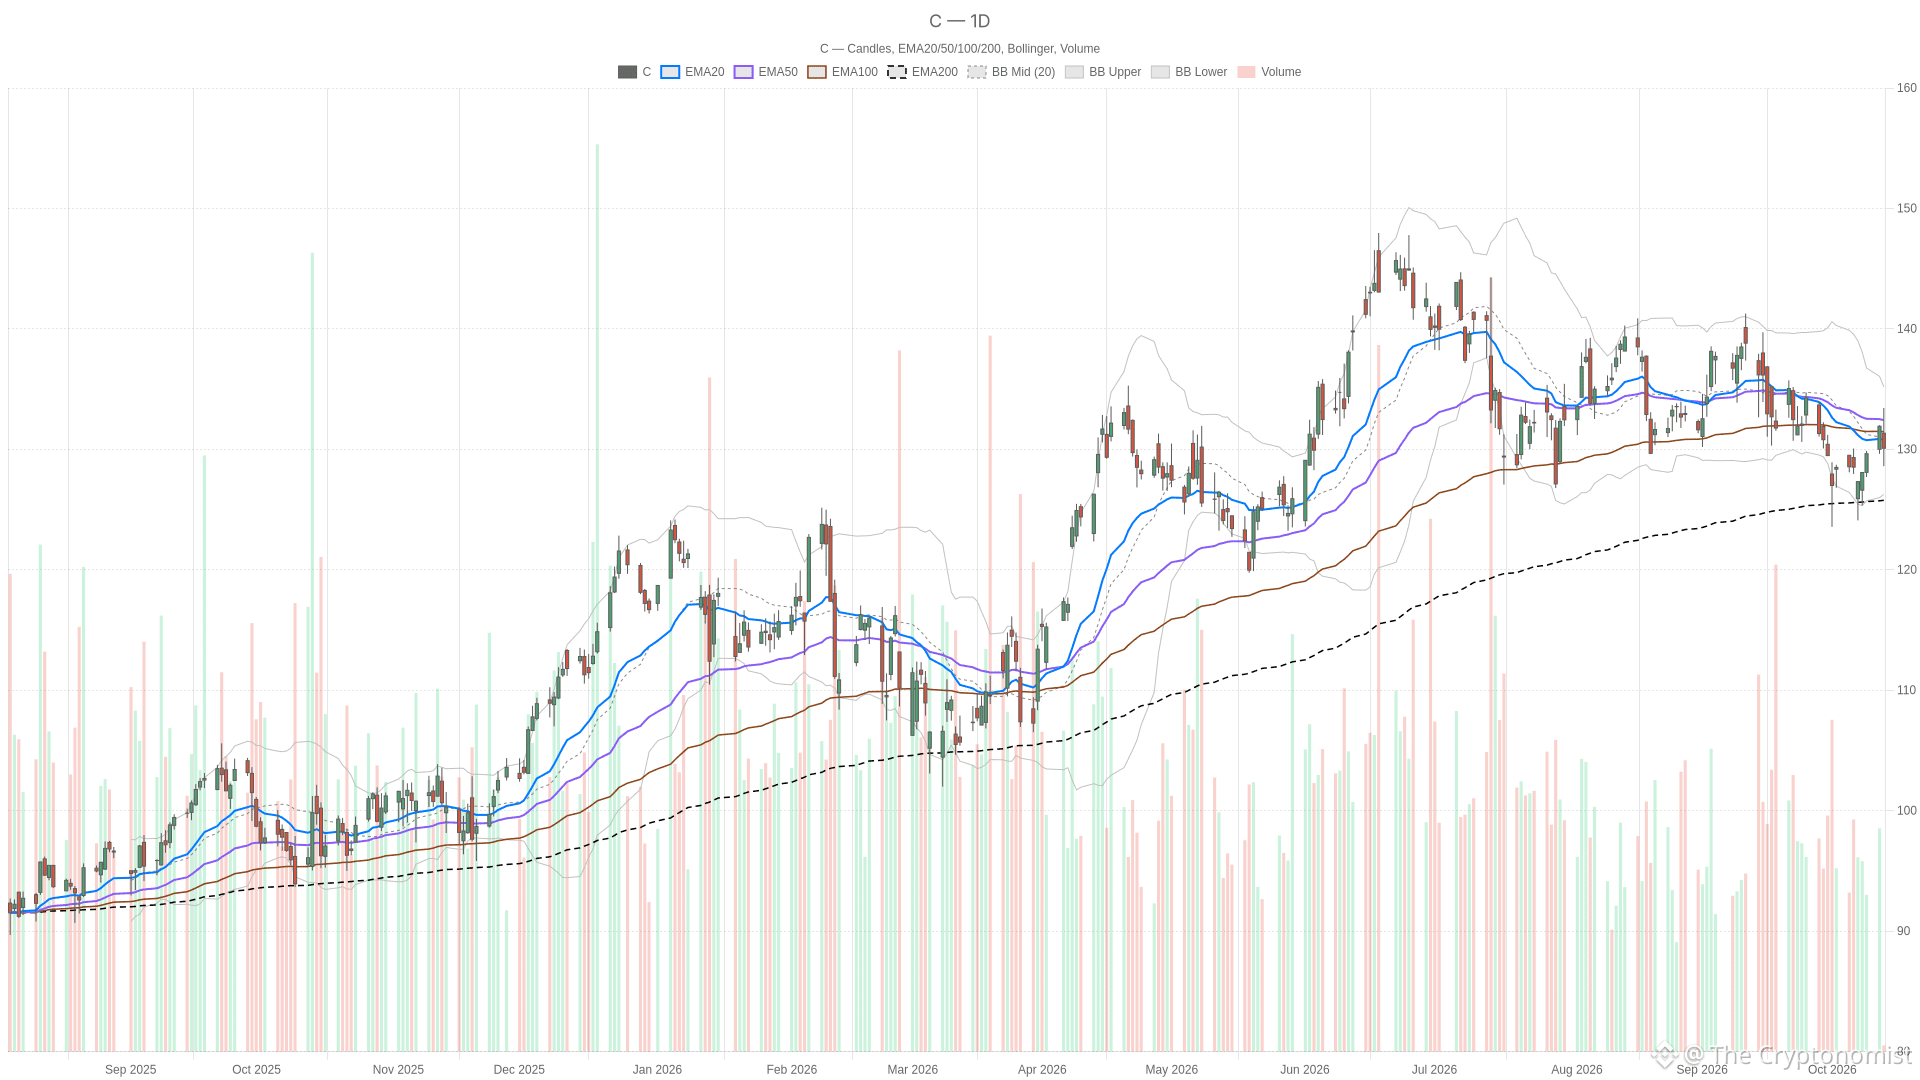 C — daily chart with candlesticks, EMA20/EMA50 and volume.
Key takeaways
Citigroup stock was trading at $130.095 as of 10:31 ET, down 1.38% from the previous close of $131.92.
Daily RSI14 is 46.48, below the neutral 50 threshold, while the daily MACD histogram is positive at 0.14.
Price is below the 20-session EMA at $130.8 and the 50-session EMA at $132.42, but above the 200-session EMA at $124.95.
Hourly RSI14 is 54.95, above 50, and price is above the 20-hour and 50-hour EMAs.
Daily ATR14 is $3.15 and daily S1 at $130.37 sits above the current price.
On Tuesday, October 13, 2026, Citigroup opened at $131.34 and traded between a low of $128.6 and a high of $133.43. It was trading at $130.095 as of 10:31 ET. The previous close was $131.92 on October 12, 2026. Opened at $131.34, traded between a low of $128.60 and a high of $133.43, and was last at $130.09, against a previous close of $131.92. The session remains open, so daily indicators are provisional.
Citigroup stock: Earnings strength versus daily resistance
Citigroup stock’s daily chart does not yet support a clear bullish thesis, despite positive third-quarter earnings reports. Before Tuesday’s open, Seeking Alpha reported that third-quarter earnings and revenue beat estimates, with growth in services and wealth. Investing.com also reported an earnings beat and said revenue reached a decade high. Bloomberg reported that fixed-income traders delivered their best third quarter in at least a decade. These reports provide positive earnings context, but do not establish why the shares were lower intraday.
Daily trend structure
However, the daily chart shows price below the 20-session EMA at $130.8 and the 50-session EMA at $132.42. It remains above the 200-session EMA at $124.95. That arrangement leaves overhead resistance without a fully bearish average alignment.
Daily momentum and volatility
Daily RSI14 stands at 46.48, below the neutral 50 threshold. In contrast, the MACD line at -1.29 sits above its signal at -1.43, producing a positive histogram of 0.14. The signals are mixed: RSI favors caution, while MACD provides a limited counterweight.
Meanwhile, price sits below the daily Bollinger mid-band at $130.72, between the lower band at $126.26 and the upper band at $135.19. The mid-band reinforces nearby overhead resistance. Daily ATR14 is $3.15, compared with $3.02 in the preceding candle. The daily first support, S1, at $130.37 is already above the current price. The daily pivot at $131.18 and first resistance, R1, at $132.74 are also overhead.
Hourly support complicates the daily view
The hourly chart offers partial support for Citigroup stock, with price above the 20-hour and 50-hour EMAs but below the 200-hour EMA. Price is above the 20-hour EMA at $129.79 and the 50-hour EMA at $129.17. However, it remains below the 200-hour EMA at $131.46. The shorter averages offer underlying support, but the full hourly structure is not bullishly aligned.
Hourly momentum and range context
Hourly RSI14 is 54.95, above 50. The MACD line at 0.93 is above its signal at 0.76, with a positive histogram of 0.17. Price also sits above the hourly Bollinger mid-band at $129.4, below the upper band at $132.62.
Nevertheless, price is below hourly S1 at $131.33 and the hourly pivot at $131.66. Hourly ATR14 is $1.07, compared with $0.78 in the preceding completed hourly candle, adding range uncertainty to the supportive momentum readings.
Short-term timing and conditional scenarios
The 15-minute chart is less supportive for Citigroup stock, with RSI14 at 41.84 below 50 and the MACD histogram negative at -0.26. Price is below the 50-quarter-hour EMA at $130.16 and the 20-quarter-hour EMA at $130.85, but above the 200-quarter-hour EMA at $129.17. It remains above the 15-minute lower Bollinger band at $129.89 and the pivot at $129.57, while sitting below the mid-band at $131.12 and first resistance, R1, at $130.53. ATR14 reads $0.75.
Bullish scenario
The bullish scenario requires reclaiming daily S1 at $130.37, then the 20-session EMA at $130.8 and the daily pivot at $131.18. Sustained acceptance above those levels would strengthen the case for confronting the 50-session EMA at $132.42, followed by daily R1 at $132.74. Daily RSI above 50 would add confirmation.
Bearish scenario
Conversely, a break below the 15-minute pivot at $129.57 would undermine the near-term bullish case. A subsequent breach of the session low at $128.6 would place the daily lower Bollinger band at $126.26 in focus. The 200-session EMA at $124.95 lies below that band.
Overall, Citigroup stock sits below daily resistance but above important hourly averages. ATR readings show wider measured ranges, while momentum differs across timeframes. The unresolved issue is whether hourly support can translate into a sustained reclaim of the daily levels. Prices and indicators are from Twelve Data.
FAQ
What are the key resistance levels for Citigroup stock?
The daily S1 at $130.37, the 20-session EMA at $130.8, the daily pivot at $131.18, and the 50-session EMA at $132.42 are all above the current price. Daily R1 stands at $132.74.
What does the hourly chart show for Citigroup stock?
Price is above the 20-hour EMA at $129.79 and the 50-hour EMA at $129.17, but below the 200-hour EMA at $131.46. Hourly RSI14 is 54.95, above 50, and the hourly MACD histogram is positive at 0.17.
Where does Citigroup stock stand relative to its moving averages?
Citigroup stock is below the 20-session EMA at $130.8 and the 50-session EMA at $132.42, but remains above the 200-session EMA at $124.95.
What are the bullish and bearish scenarios for Citigroup stock?
The bullish scenario requires reclaiming daily S1 at $130.37, then the 20-session EMA at $130.8 and the daily pivot at $131.18. The bearish scenario involves a break below the 15-minute pivot at $129.57, followed by the session low at $128.6, which would bring the daily lower Bollinger band at $126.26 into focus.
Disclaimer: This article is for informational purposes only and does not constitute financial advice, an investment recommendation, or a solicitation to buy or sell any financial instrument. The analysis provided is not indicative of future results. Investing in financial markets carries a high risk of capital loss. Always do your own research (DYOR) and consult a qualified financial advisor before making any decision.
Cryptonomist and the author hold no positions in the financial instruments mentioned and receive no compensation from the companies covered.
Article produced with the assistance of artificial intelligence and reviewed by the editorial team.