


Goldman Sachs Group stock retains a bearish daily bias despite positive short-term momentum and earnings coverage published on Tuesday. Price remains below its key exponential averages. GS opened at $898.39, traded between a low of $887.78 and a high of $902.29, and closed at $893.95, against a previous close of $895.32. However, a positive MACD histogram complicates the downside case, while the hourly chart offers only partial bullish confirmation.
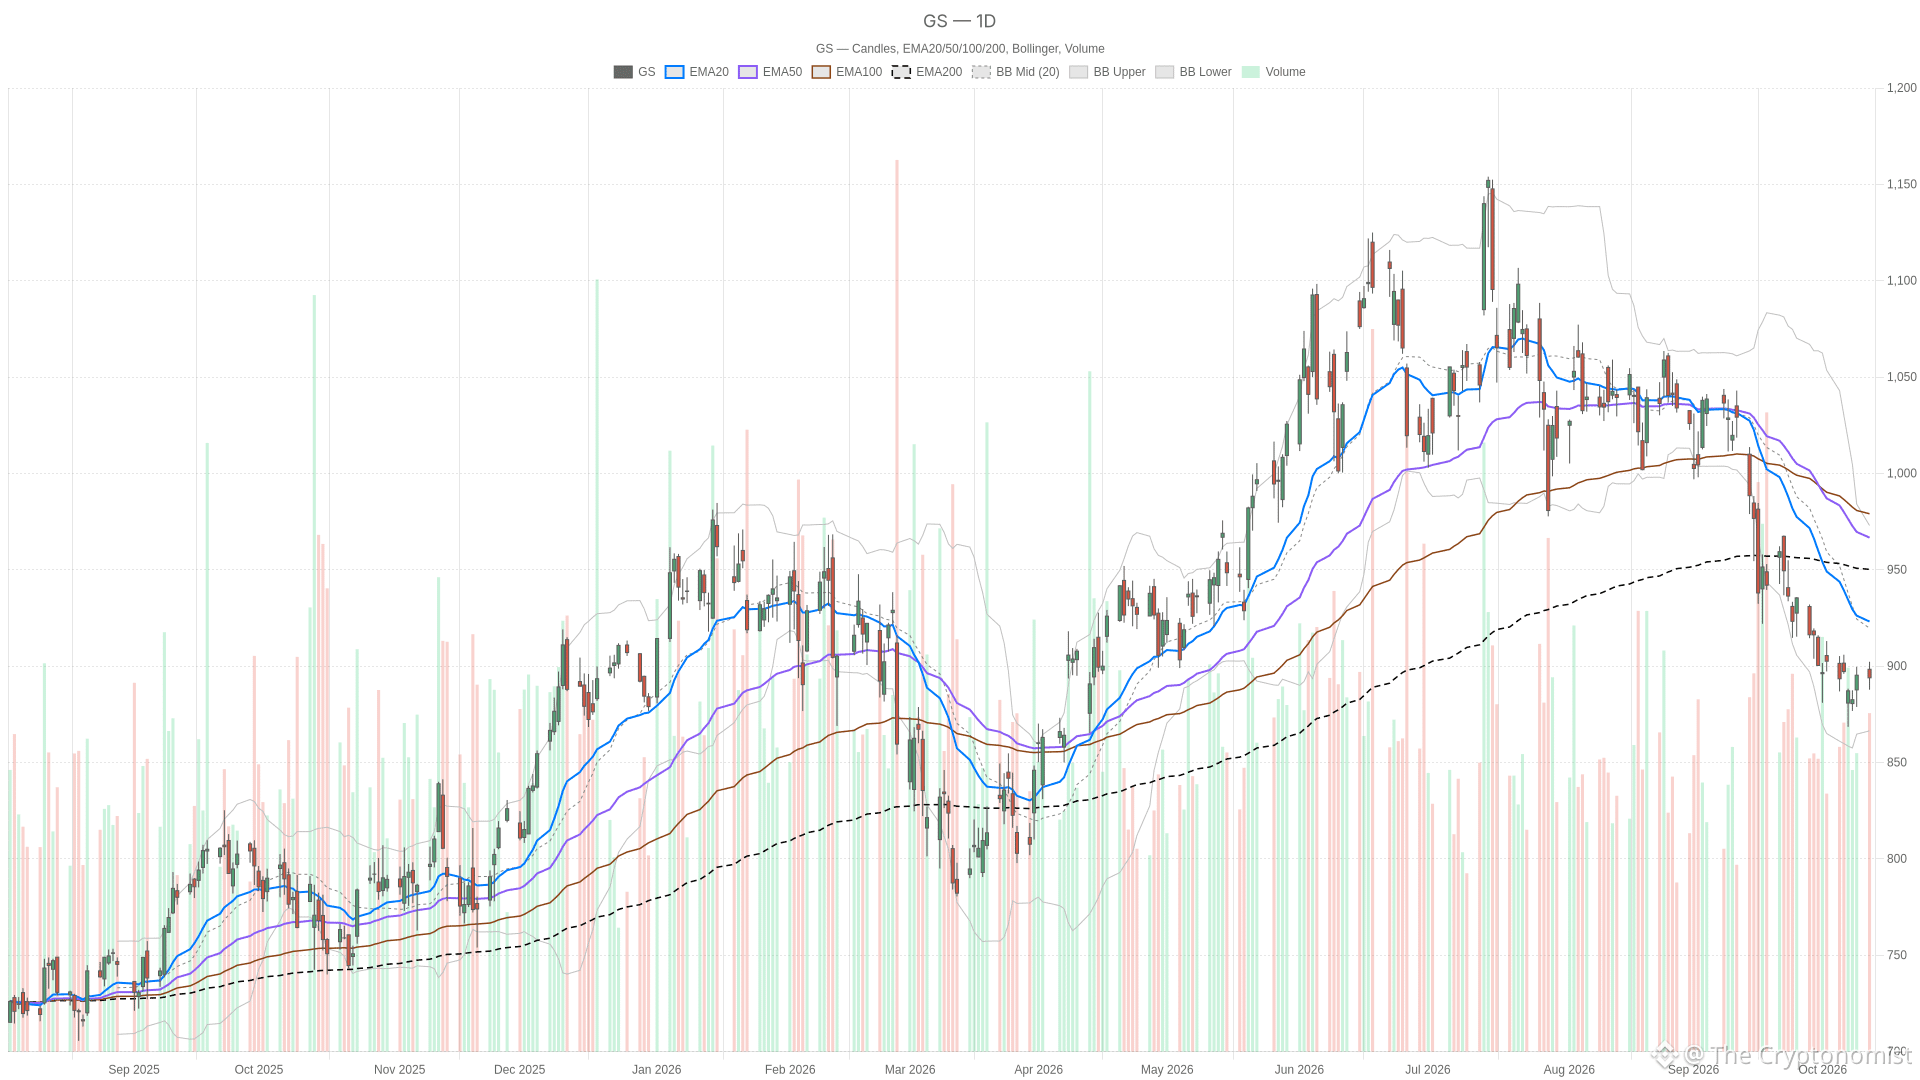 GS — daily chart with candlesticks, EMA20/EMA50 and volume.
Key takeaways
Goldman Sachs Group stock closed Monday at $893.95, down 0.15% from the previous close, below all three daily exponential averages.
The daily 20-session EMA is $923.14, the 50-session EMA is $966.68, and the 200-session EMA is $943.68 — price sits beneath all three.
Daily RSI14 is 34.42, below the neutral 50; the MACD histogram is 0.54 with the MACD line at -30.05.
Hourly RSI14 is 55.74, above 50, with the hourly MACD histogram at 0.68; the close sits above the 20-hour EMA at $890.49.
Earnings reports published Tuesday after Monday’s close indicated a third-quarter beat: Seeking Alpha cited asset and wealth management growth, while Bloomberg noted equities traders exceeded expectations but fixed-income trading fell short of estimates.
Earnings reports add context after Monday’s session
Tuesday’s earnings reports, all published after Monday’s close, introduce news the session’s chart does not capture. Seeking Alpha reported that third-quarter earnings beat estimates, citing asset and wealth management growth offsetting slower markets revenue. Investing.com also described an earnings beat, emphasizing trading strength.
Yahoo Finance, reporting after Monday’s close, noted that third-quarter profits rose 29% from a year earlier, citing solid trading and dealmaking results. However, Bloomberg highlighted uneven performance: equities traders exceeded expectations, while fixed-income and rates trading fell short of estimates. The earnings coverage is therefore positive overall, but not uniform across businesses.
Goldman Sachs Group stock faces a bearish daily structure
On Monday, October 12, 2026, GS opened at $898.39 and closed at $893.95. The session ranged between a low of $887.78 and a high of $902.29, with a move of -0.15% versus the previous close. The completed session sits below the daily averages.
The daily 20-session EMA stands at $923.14. It sits below the 200-session EMA at $943.68 and the 50-session EMA at $966.68. GS closed beneath all three. This positioning favors the bearish case, although the averages are not fully stacked in bearish order.
In contrast, daily momentum is mixed. RSI14 stands at 34.42, below 50 but above the oversold threshold. The MACD line is -30.05, above its signal at -30.59, with a positive histogram of 0.54. The line remains below zero, so the bullish line-versus-signal relationship does not establish a bullish daily trend.
The daily Bollinger mid-band is $919.7, with the upper band at $972.98 and the lower band at $866.41. Monday’s close sits below the midpoint and above the lower band. Daily ATR14 reads $21.61, providing a volatility reference rather than a directional signal.
For the next session, the daily pivot is $894.67. Daily first resistance is $901.57, and daily first support is $887.06. The completed session’s price is below that next-session pivot, making it the first daily reference to reclaim.
Hourly strength complicates the daily bias
Meanwhile, the hourly chart gives a more constructive but incomplete picture. Monday’s close sits above the 20-hour EMA at $890.49, but below the 50-hour EMA at $894.12. It also remains below the 200-hour EMA at $942.79. Short-term support from the nearest average therefore coexists with resistance from the longer hourly averages.
Hourly RSI14 is 55.74, above 50. The MACD line at 0.73 is above its signal at 0.06, while the histogram stands at 0.68. Those readings favor bullish hourly momentum, in conflict with the bearish daily price positioning. Price is above the hourly Bollinger midpoint at $888.42 and below the upper band at $899.74; the lower band is $877.11. Hourly ATR14 is $5.02.
For the next session, the hourly pivot is $892.95, with hourly first resistance at $895.64 and first support at $891.25. The session’s closing price is above that pivot. This offers a nearby support reference, but does not remove the overhead hourly averages.
Execution context and conditional scenarios
15-minute chart and short-term timing
At the same time, the 15-minute chart offers short-term bullish timing without changing the daily bias. Price sits above the 20-quarter-hour EMA at $891.7 and the 50-quarter-hour EMA at $890.75, but below the 200-quarter-hour EMA at $894.16. RSI14 is 60.94, above 50 and below overbought territory. The MACD line at -0.06 is above its signal at -0.08, with a positive histogram of 0.02.
Price also sits above the 15-minute Bollinger upper band at $893.85. Its midpoint is $891.68 and lower band is $889.51, while ATR14 reads $2.27. For the next session, the 15-minute pivot is $893.19, first resistance is $895.4, and first support is $891.74. These are execution references, not evidence of a bullish daily trend.
Bullish scenario and overhead resistance
The bullish scenario requires a reclaim of the next-session daily pivot at $894.67, followed by a break above daily first resistance at $901.57. Beyond that, the daily Bollinger midpoint at $919.7 and 20-session EMA at $923.14 are the next named overhead references. Holding above those levels would weaken the bearish daily case.
Bearish scenario and downside support
Conversely, a break below next-session daily first support at $887.06 would undermine the bullish scenario. The daily lower Bollinger band at $866.41 would then become the lower reference. Positive hourly readings alone would not offset a failure of that daily support.
Overall, Goldman Sachs Group stock stands below its daily averages but above several short-term references. Twelve Data’s price and indicator readings show daily ATR14 at $21.61 alongside mixed momentum signals. The unresolved question is whether Tuesday’s earnings coverage is accompanied by price acceptance above daily resistance; Monday’s completed chart cannot establish that.
FAQ
What is the daily trend structure for Goldman Sachs Group stock?
Goldman Sachs Group stock closed Monday at $893.95, below the daily 20-session EMA at $923.14, the 50-session EMA at $966.68, and the 200-session EMA at $943.68. This positioning favors the bearish case. Daily RSI14 is 34.42, below the neutral 50, while the MACD histogram is positive at 0.54 with the MACD line at -30.05.
What are the next-session support and resistance levels for GS?
The daily pivot for the next session is $894.67, with first resistance at $901.57 and first support at $887.06. The daily Bollinger mid-band is $919.7, with the upper band at $972.98 and the lower band at $866.41. On the hourly chart, the pivot is $892.95, with first resistance at $895.64 and first support at $891.25.
What did Tuesday’s earnings reports show for Goldman Sachs?
Reports published on Tuesday after Monday’s close indicated Goldman Sachs beat third-quarter earnings estimates. Seeking Alpha reported that asset and wealth management growth offset slower markets revenue. Bloomberg highlighted uneven performance: equities traders exceeded expectations, while fixed-income and rates trading fell short of estimates. Yahoo Finance reported that third-quarter profits rose 29% from a year earlier.
How do the hourly and daily signals compare for GS?
The daily chart shows a bearish bias with price below all three exponential averages and daily RSI14 at 34.42. In contrast, the hourly chart shows short-term strength: hourly RSI14 is 55.74, above 50, and the hourly MACD histogram is positive at 0.68. However, Monday’s close remains below the 50-hour EMA at $894.12 and the 200-hour EMA at $942.79, limiting the bullish hourly case.
Disclaimer: This article is for informational purposes only and does not constitute financial advice, an investment recommendation, or a solicitation to buy or sell any financial instrument. The analysis provided is not indicative of future results. Investing in financial markets carries a high risk of capital loss. Always do your own research (DYOR) and consult a qualified financial advisor before making any decision.
Cryptonomist and the author hold no positions in the financial instruments mentioned and receive no compensation from the companies covered.
Article produced with the assistance of artificial intelligence and reviewed by the editorial team.