

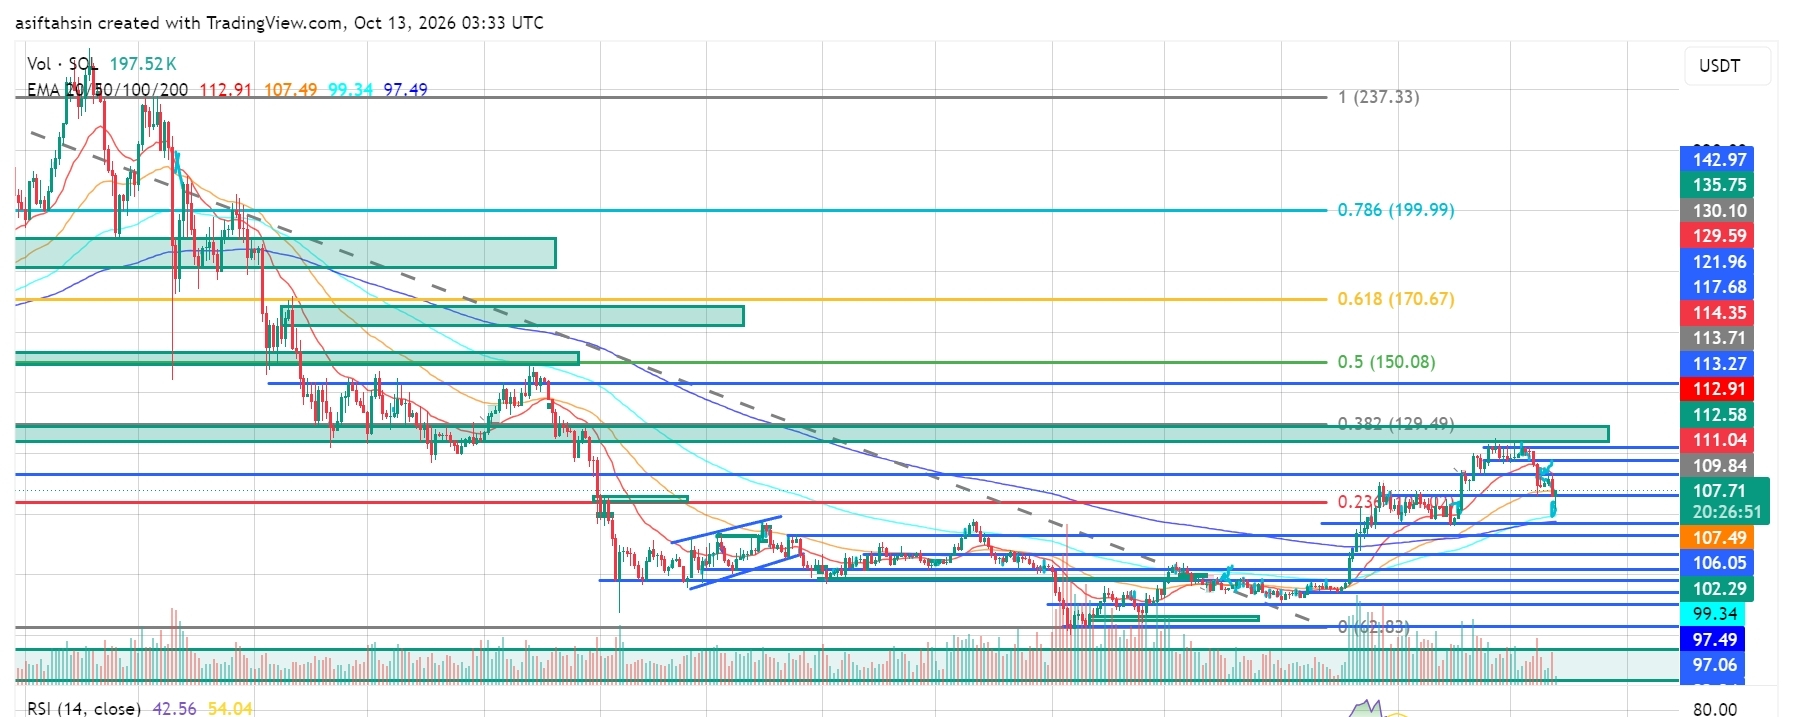

SOL is currently trading around $107.70, pulling back sharply after facing rejection from the $111–$113 resistance zone.
The broader recovery structure is under pressure as price falls back toward the short-term moving averages and nearby support. SOL needs to defend the $106–$107 region and reclaim $109.84–$111.04 to restore bullish momentum.
📈 EMA Structure
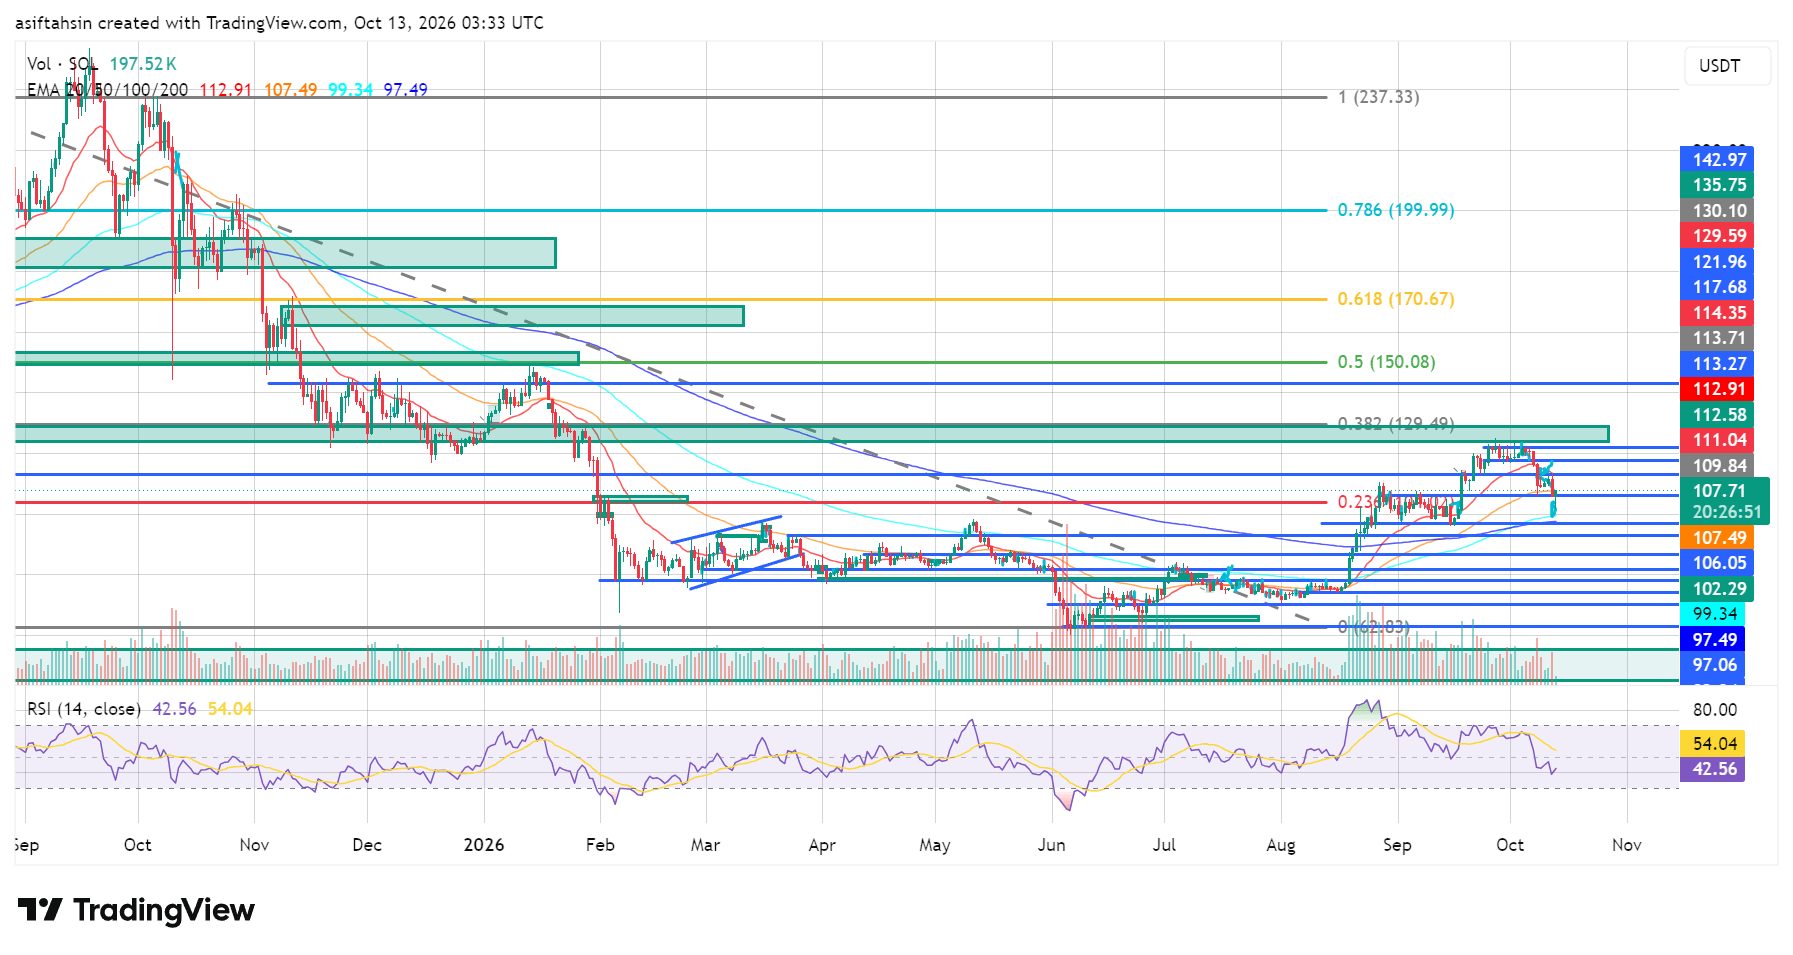
20 EMA: $112.91 50 EMA: $107.49 100 EMA: $99.34 200 EMA: $97.49
SOL has dropped below the 20 EMA at $112.91, signaling weakening short-term momentum.
Price is now testing the 50 EMA around $107.49. Holding this level could support a recovery, while a sustained breakdown could expose lower support around $106.05 and $102.29.
The 100 EMA and 200 EMA remain below price, keeping the broader recovery structure alive as long as those deeper supports hold.
📐 Fibonacci Levels
0.236: $114.35 0.382: $129.49 0.5: $150.08 0.618: $170.67 0.786: $199.99 1.0: $237.33
SOL has pulled back below the $114.35 Fibonacci level, weakening the immediate bullish setup.
The first challenge for buyers is to reclaim $109.84–$112.91, followed by $114.35. A stronger recovery above $114.35 would bring $129.49 back into focus.
🟢 Bullish Scenario
SOL needs to stabilize above $106.05–$107.49 and reclaim the nearby resistance levels.
Key resistance levels:
$109.84 → $111.04 → $112.58 → $112.91 → $113.71 → $114.35
A sustained move above $114.35 could open the way toward:
$117.68 → $121.96 → $129.49 → $135.75 → $142.97 → $150.08
The $129.49 level remains the next major Fibonacci resistance if buyers regain control.
🔴 Pullback Scenario
Important support levels:
$107.49 → $106.05 → $102.29 → $99.34 → $97.49 → $97.06 → $92.94 → $86.69
The $106.05–$107.49 zone is the immediate area to watch.
If SOL loses this zone decisively, price could move toward $102.29, where the next meaningful support area sits near the 100 EMA at $99.34.
A sustained break below $99.34 would weaken the broader recovery structure further.
🧠 Market Structure & Liquidity
The broader chart shows:
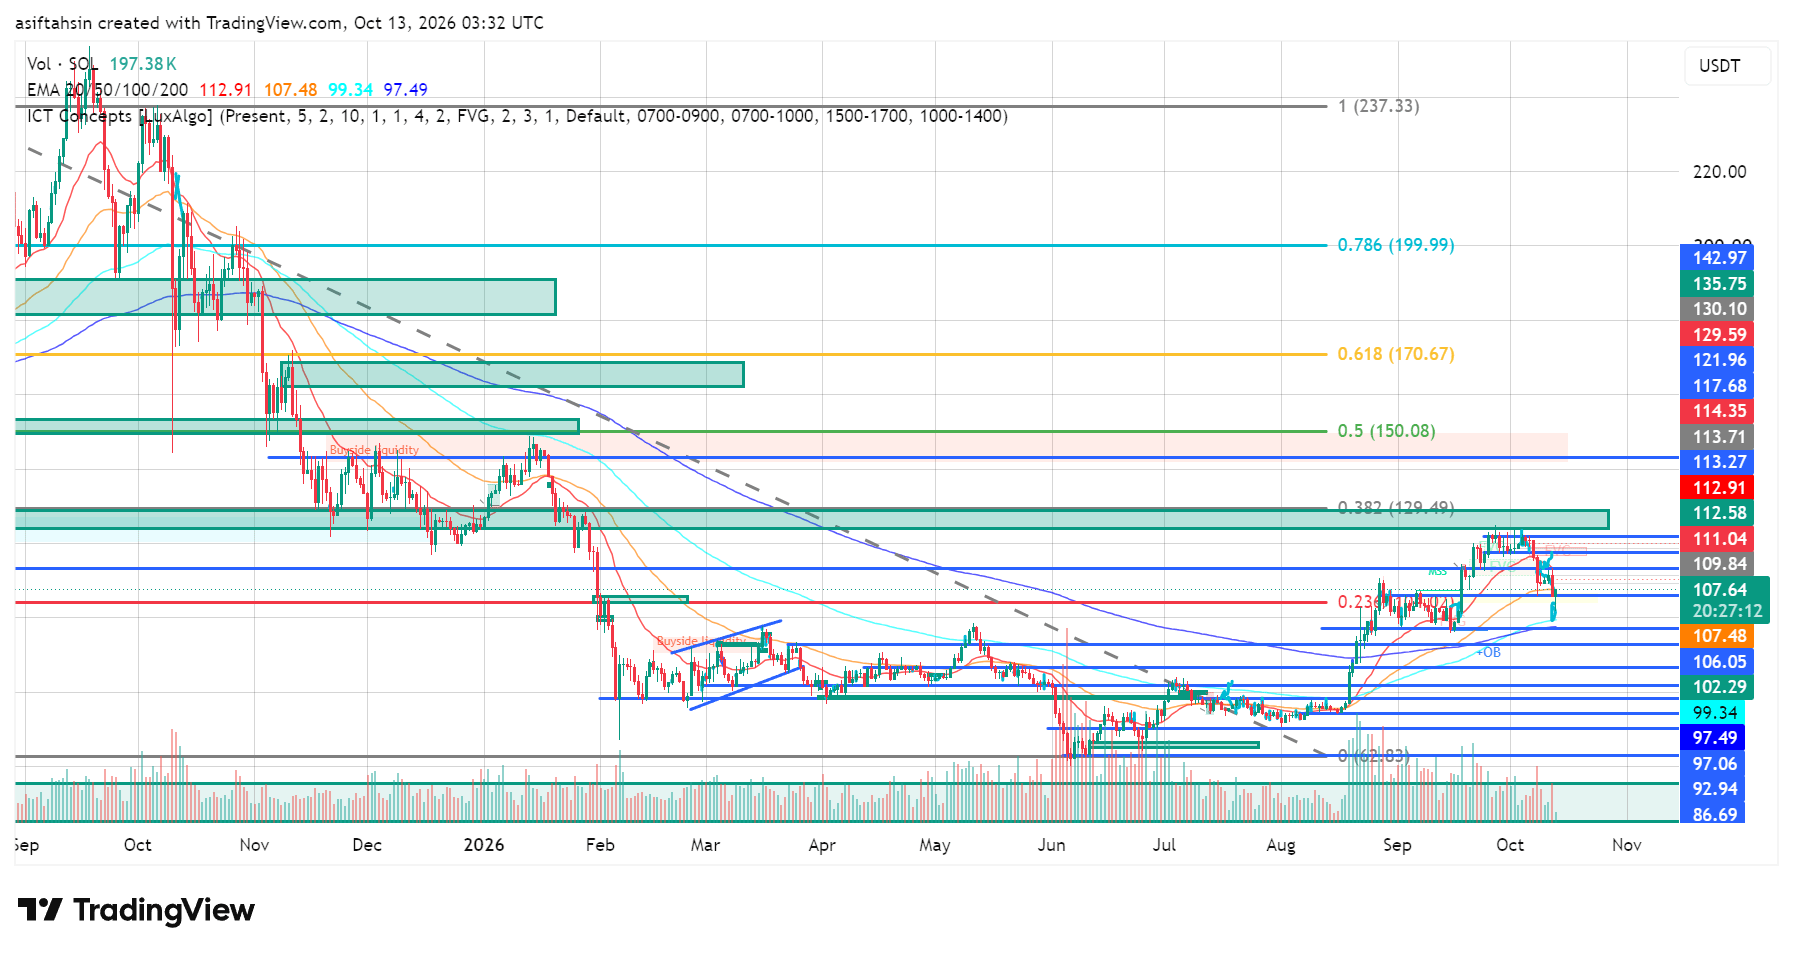
Liquidity Sweep → Accumulation → Higher Lows → Breakout → Expansion → Resistance Rejection → Pullback → Support Test
SOL recovered strongly from the June low near $86.83 and rallied through the $100 region before approaching the $111–$114 resistance area.
The latest rejection has brought price back toward the $106–$107 support zone. Buyers need to defend this area to prevent the pullback from developing into a deeper correction.
📊 RSI Momentum
RSI: 42.56 RSI MA: 54.04
RSI has fallen below the neutral 50 level and is trading below its moving average.
This indicates that selling pressure has increased and short-term momentum currently favors sellers. A recovery above 50 would be an early sign of improving momentum, while further weakness could put additional pressure on support.
🎯 Key Levels
Resistance: $109.84 → $111.04 → $112.58 → $112.91 → $114.35
Support: $107.49 → $106.05 → $102.29 → $99.34 → $97.49
Major EMA Support: $107.49 → $99.34 → $97.49
Upside Targets After Recovery: $114.35 → $117.68 → $121.96 → $129.49 → $135.75
📌 Final Outlook
SOL is at an important support zone after losing the 20 EMA and falling below $114.35. RSI also confirms that short-term momentum has weakened.
The key level is $106.05–$107.49.
If buyers defend this region and reclaim $109.84–$112.91, SOL could attempt another move toward $114.35 and $117.68.
However, a decisive breakdown below $106.05 could expose $102.29 and the $99.34–$97.49 support zone.
Bias: Short-term momentum is bearish while SOL remains below $112.91. Holding $106.05–$107.49 could support a recovery, but a sustained break below $106.05 would increase downside risk toward $102.29 and $99.34.
