#cryptotradingpro #BTC
🚀 $BTC /USD Analysis (4H): Signals, Liquidity, and Key Levels
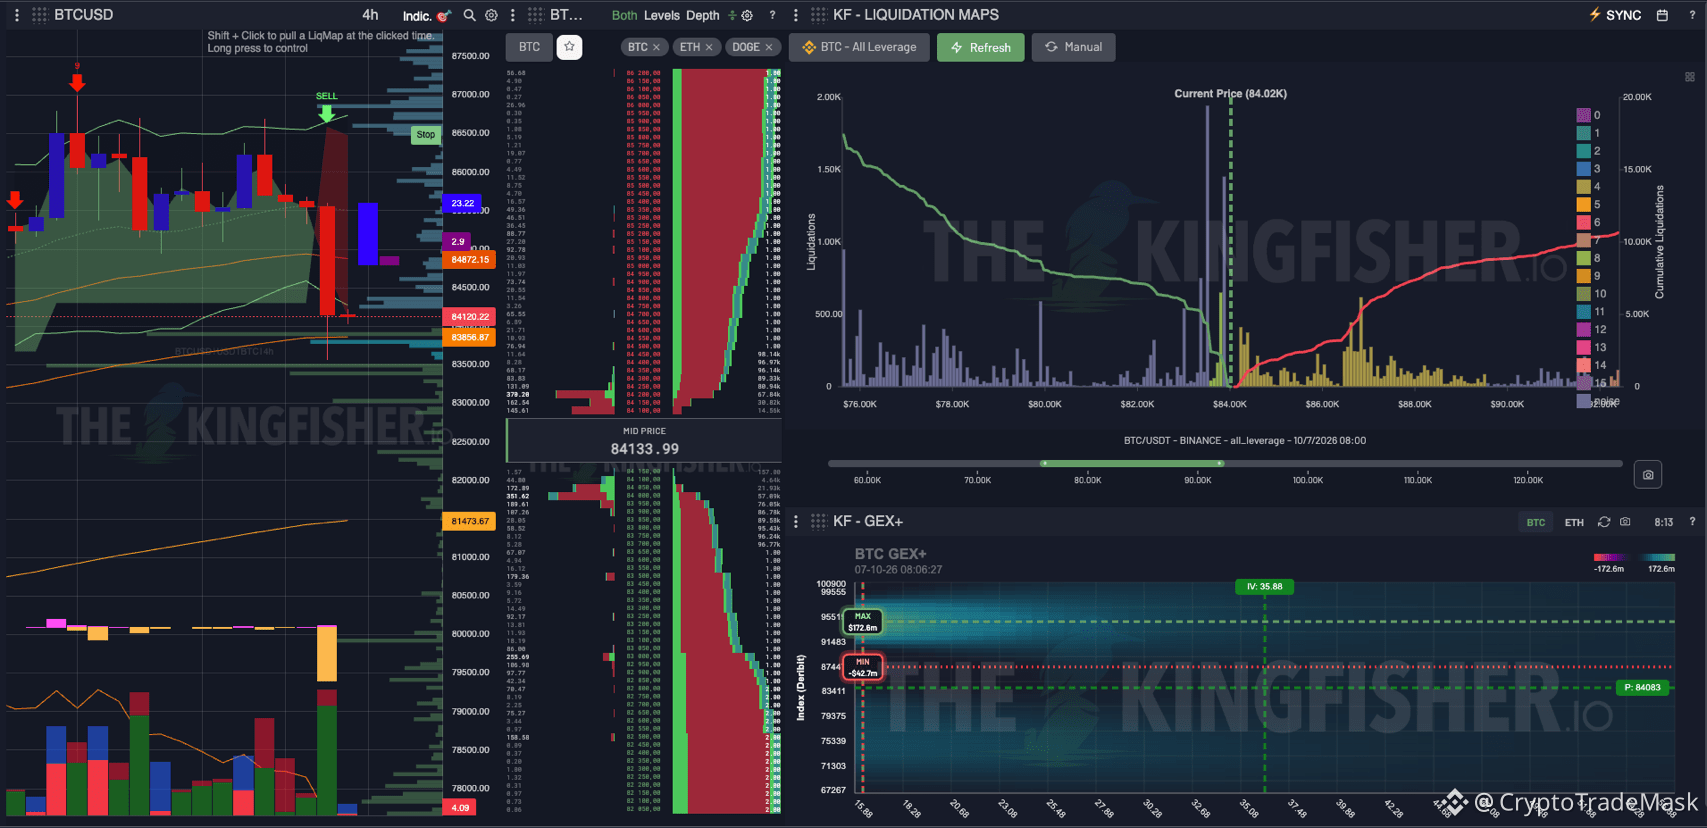
Bitcoin is trading around $84,100–$84,200 following an upward surge to a local high of ~$87,500 and a subsequent sharp pullback. A critical juncture is forming on the chart—let's break down the details:
1️⃣ Technical Outlook and Volume
Local Resistance: Sellers stepped in at the $87,000–$87,500 levels, triggering a red SELL signal.
High Liquidity Zone (POC): The bulk of trading volume is concentrated in the narrow $83,800–$84,500 range. This is precisely where the battle for market control is currently taking place.
2️⃣ Order Book and Liquidation Map (KF Maps)
Selling Pressure from Above: The order book shows a massive wall of limit sell orders (Asks) stretching from $84,500 to $87,000+.
Where is the liquidity?
Longs (Below): A cluster of stop-losses and long-position liquidations extends from $83,000 to $84,000.
Shorts (Above): A large pool of liquidation levels has accumulated in the $85,000–$88,000+ range. Options & GEX+: The key Maximum Exposure (MEX) zone is located at $91,728, while the nearest significant resistance based on the options profile is $87,441.
3️⃣ Potential movement scenarios
1. Long liquidity squeeze (Local sweep):
A quick spike down to the $82,500–$83,500 zone is possible to trigger buyers' stop-losses before a full-scale recovery begins.
2. Short squeeze (Bullish scenario):
If the price breaks and holds above $85,000, a cascade of short liquidations will be triggered, with potential targets at $87,440 and $90,000+.
⚠️ Summary: The market is squeezed between two large liquidation pools. The priority is to monitor the price reaction at the $83,500 and $85,000 levels while maintaining strict risk management.
🚀 $BTC /USD Analysis (4H): Signals, Liquidity, and Key Levels
Bitcoin is trading around $84,100–$84,200 following an upward surge to a local high of ~$87,500 and a subsequent sharp pullback. A critical juncture is forming on the chart—let's break down the details:
1️⃣ Technical Outlook and Volume
Local Resistance: Sellers stepped in at the $87,000–$87,500 levels, triggering a red SELL signal.
High Liquidity Zone (POC): The bulk of trading volume is concentrated in the narrow $83,800–$84,500 range. This is precisely where the battle for market control is currently taking place.
2️⃣ Order Book and Liquidation Map (KF Maps)
Selling Pressure from Above: The order book shows a massive wall of limit sell orders (Asks) stretching from $84,500 to $87,000+.
Where is the liquidity?
Longs (Below): A cluster of stop-losses and long-position liquidations extends from $83,000 to $84,000.
Shorts (Above): A large pool of liquidation levels has accumulated in the $85,000–$88,000+ range. Options & GEX+: The key Maximum Exposure (MEX) zone is located at $91,728, while the nearest significant resistance based on the options profile is $87,441.
3️⃣ Potential movement scenarios
1. Long liquidity squeeze (Local sweep):
A quick spike down to the $82,500–$83,500 zone is possible to trigger buyers' stop-losses before a full-scale recovery begins.
2. Short squeeze (Bullish scenario):
If the price breaks and holds above $85,000, a cascade of short liquidations will be triggered, with potential targets at $87,440 and $90,000+.
⚠️ Summary: The market is squeezed between two large liquidation pools. The priority is to monitor the price reaction at the $83,500 and $85,000 levels while maintaining strict risk management.