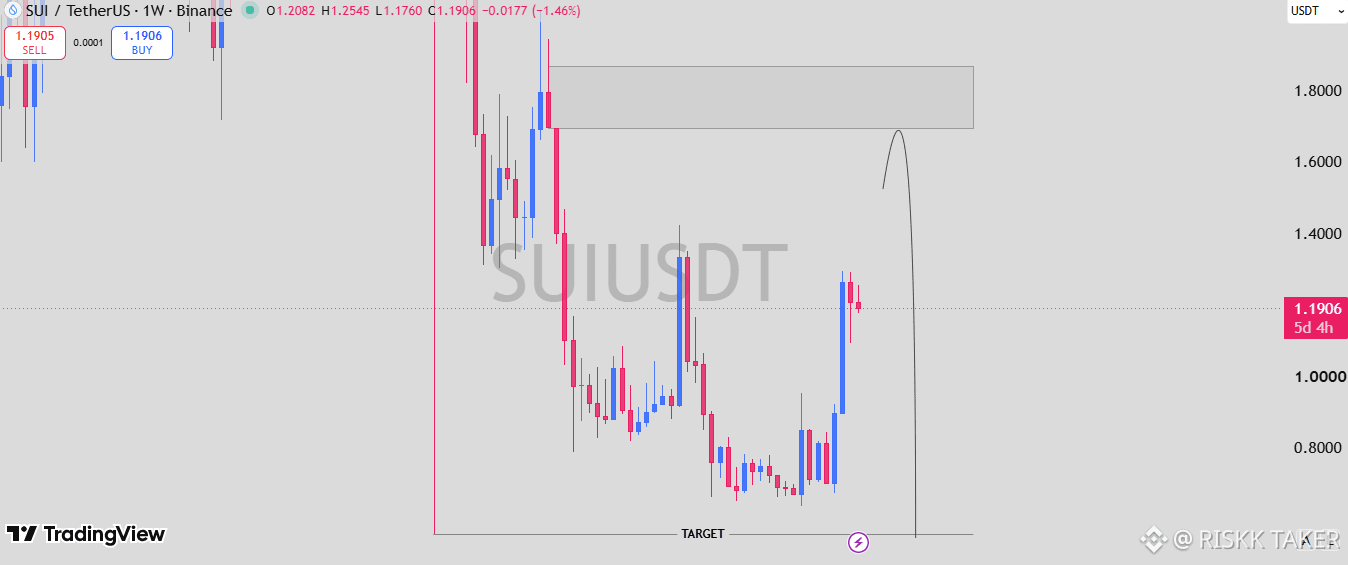
$SUI has shifted significantly from the weakness visible around the $0.65–$0.75 area. The weekly chart now shows a strong recovery, with price reclaiming $1.00 and pushing toward $1.30 before beginning to consolidate around $1.19.
The important part of this chart is not simply the recent rally; it is what happens when SUI approaches the marked $1.68–$1.85 supply zone. This is where the recovery could face its biggest test.
A rejection there would suggest that the current move is still a corrective recovery rather than a confirmed long-term trend reversal.
On the other hand, if buyers continue defending higher levels and SUI eventually secures a weekly close above $1.85, the entire structure would become much more convincing for continuation.
For now, $1.20–$1.30 is the immediate area to watch for strength, while $1.00 remains an important structural level below.
Current SUI market data places the token near $1.19 after a modest daily decline.
The important part of this chart is not simply the recent rally; it is what happens when SUI approaches the marked $1.68–$1.85 supply zone. This is where the recovery could face its biggest test.
A rejection there would suggest that the current move is still a corrective recovery rather than a confirmed long-term trend reversal.
On the other hand, if buyers continue defending higher levels and SUI eventually secures a weekly close above $1.85, the entire structure would become much more convincing for continuation.
For now, $1.20–$1.30 is the immediate area to watch for strength, while $1.00 remains an important structural level below.
Current SUI market data places the token near $1.19 after a modest daily decline.