



Key Highlights
XRP: Breakout confirmed; holding $1.50 could open a move toward $1.62.
QNT: Needs an hourly close above $262 to target $315, then $344.
INJ: Retesting near $7.33; a successful defense could point toward $13.40.
All three setups remain conditional, with their required triggers not yet confirmed.
Three altcoins are setting up simultaneously for potential breakouts this week — and technical analyst Ali Martinez (@alicharts) has mapped the exact levels that determine whether each setup confirms or fails. The thread covers XRP, Quant (QNT), and Injective (INJ), each at a structurally distinct decision point on their respective charts.
The common thread across all three: compressed price action reaching resolution zones. Each asset faces a binary outcome at a specific level — either buyers defend the structure and extension follows, or the setup invalidates. At the time of writing, XRP is trading at approximately $1.51, up 1.03% over the past 24 hours, with a market cap of $95.5 billion.
Signal 1 — XRP: Triangle Breakout Above Descending Resistance
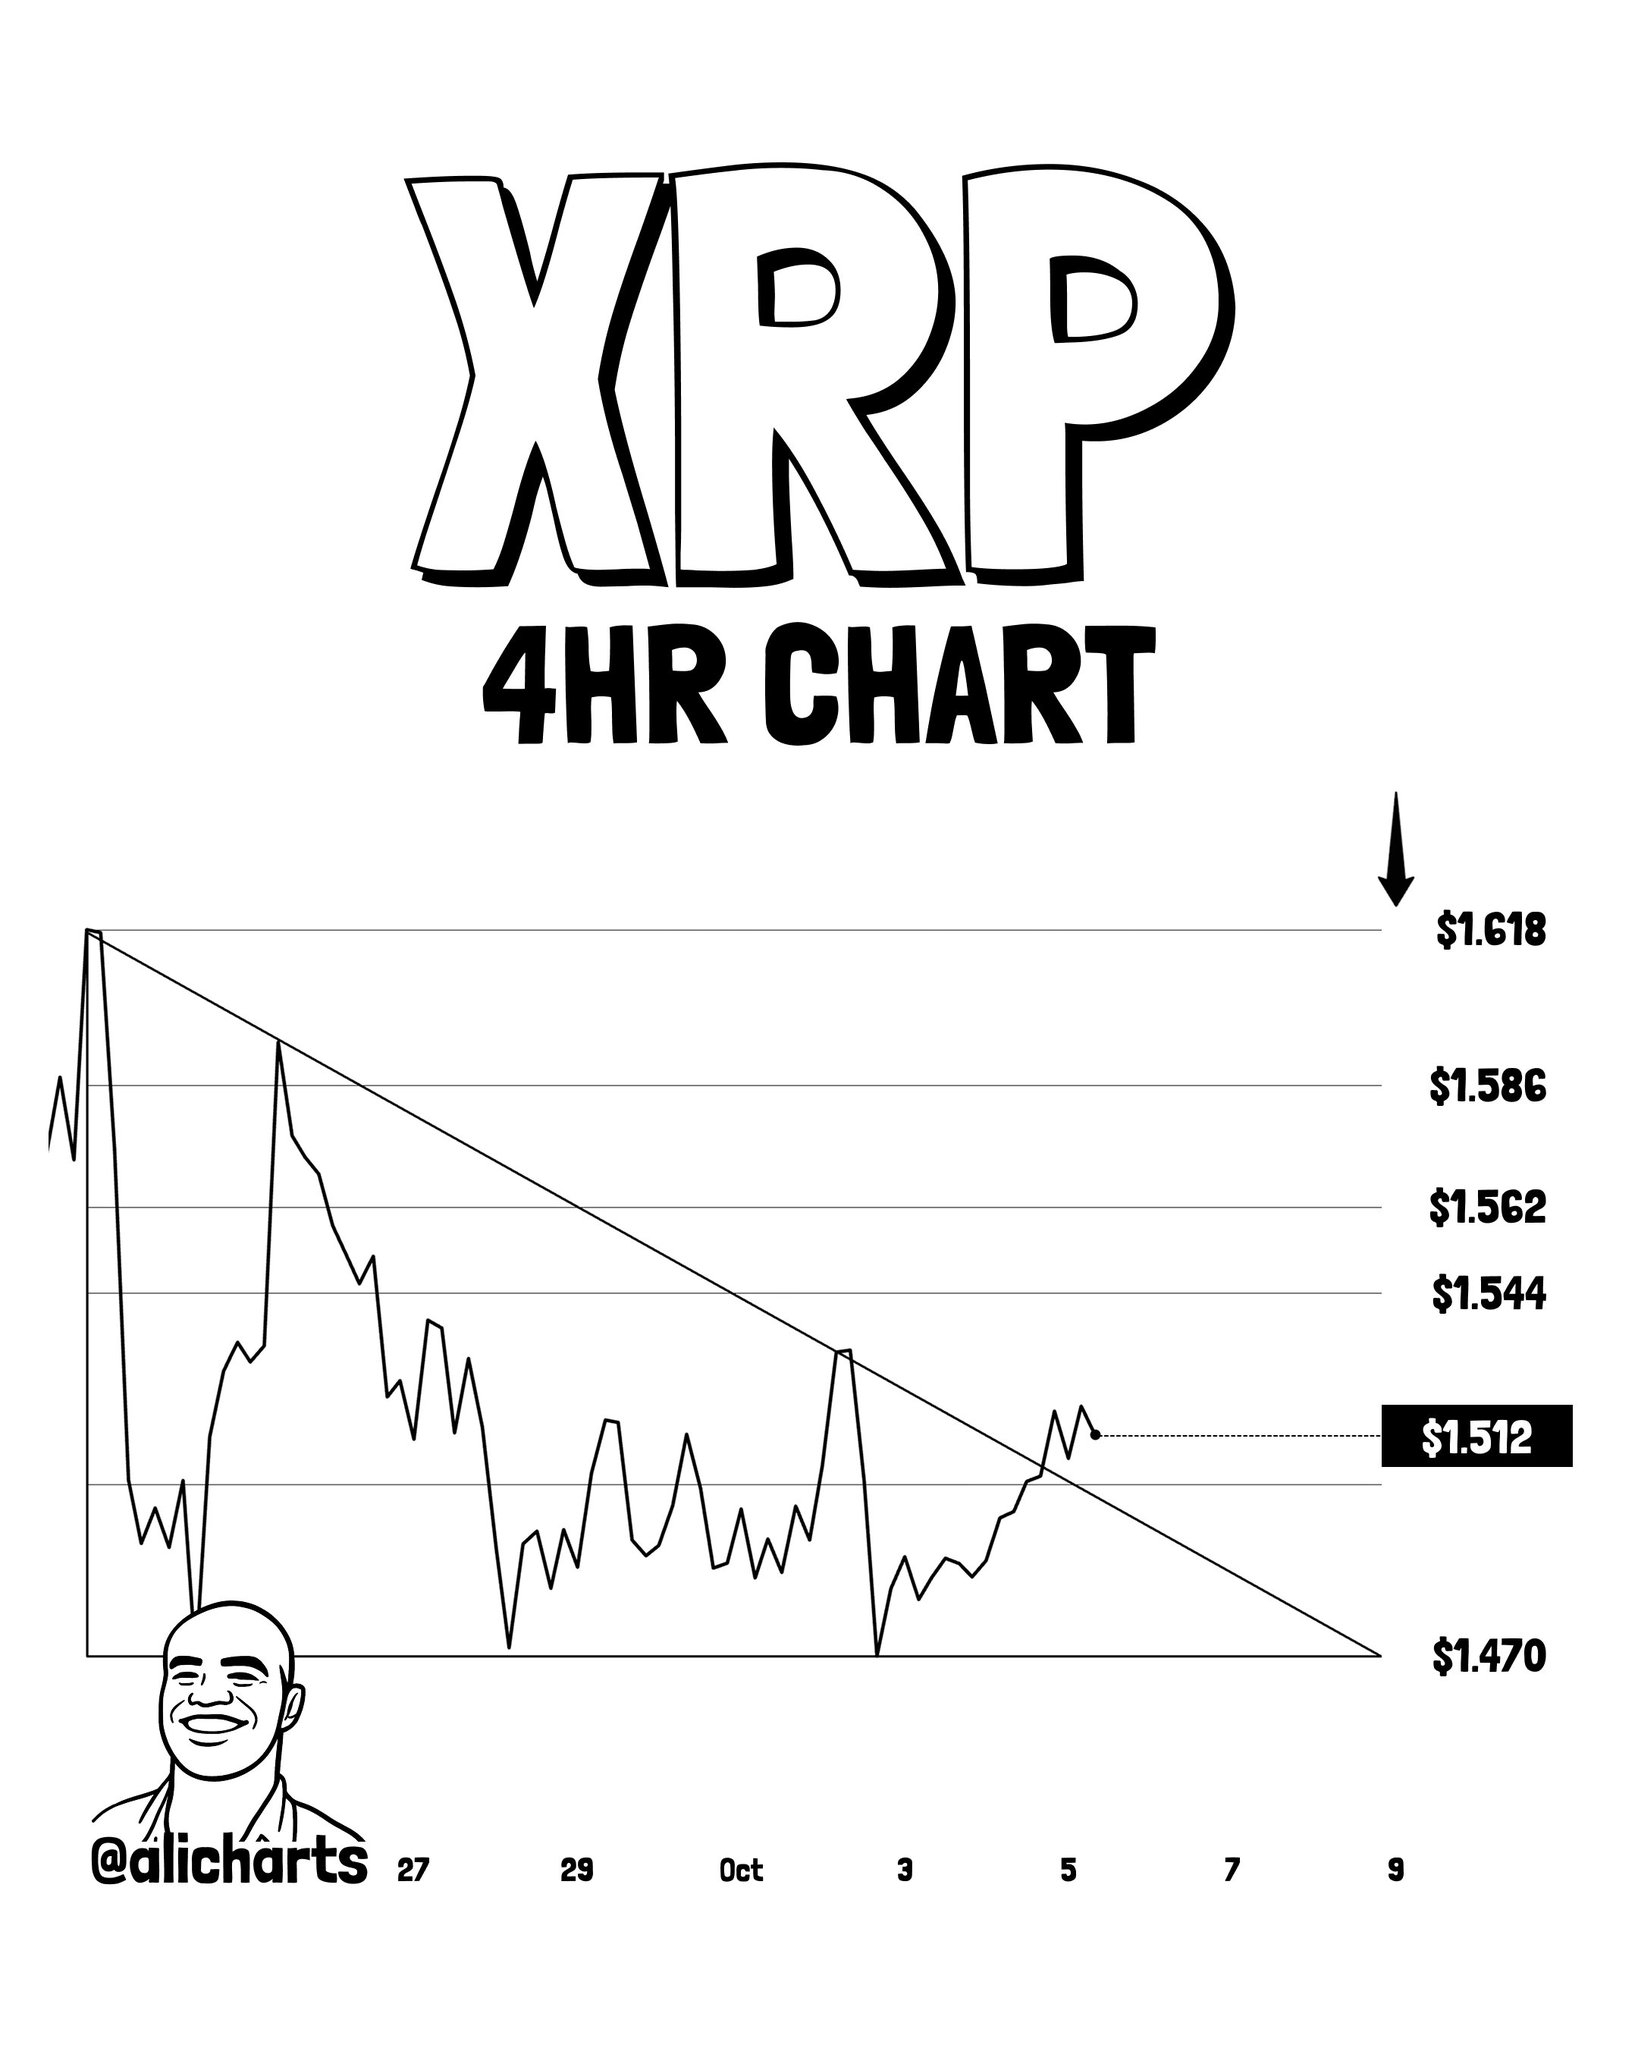
The four-hour XRP chart shared by @alicharts spans September 27 through October 9 and shows a descending triangle pattern — a declining upper resistance trendline connecting successive lower highs, converging toward a flatter lower support zone. Price has made a decisive upward pierce through that descending resistance line near the right edge of the pattern, with the chart printing $1.512 as the current breakout area (highlighted in a black box).
XRP 4HR Chart Analysis | Source: @alicharts (X)
The analyst’s condition is explicit: “If $1.50 holds as support, I’m watching for a move toward $1.62.” The chart labels $1.618 as the overhead target — the level marked with a downward arrow indicating prior resistance. Intermediate chart labels include $1.544, $1.562, $1.586, and $1.618, positioning those as the progression of overhead levels price must work through. The $1.50 level functions as the confirmation floor: as long as price does not close back below it on the four-hour timeframe, the breakout structure remains valid. A failure to hold $1.50 would invalidate the pattern and likely pull price back toward the $1.470 support zone printed on the chart.
Signal 2 — QNT: Wedge Apex Compression at $253
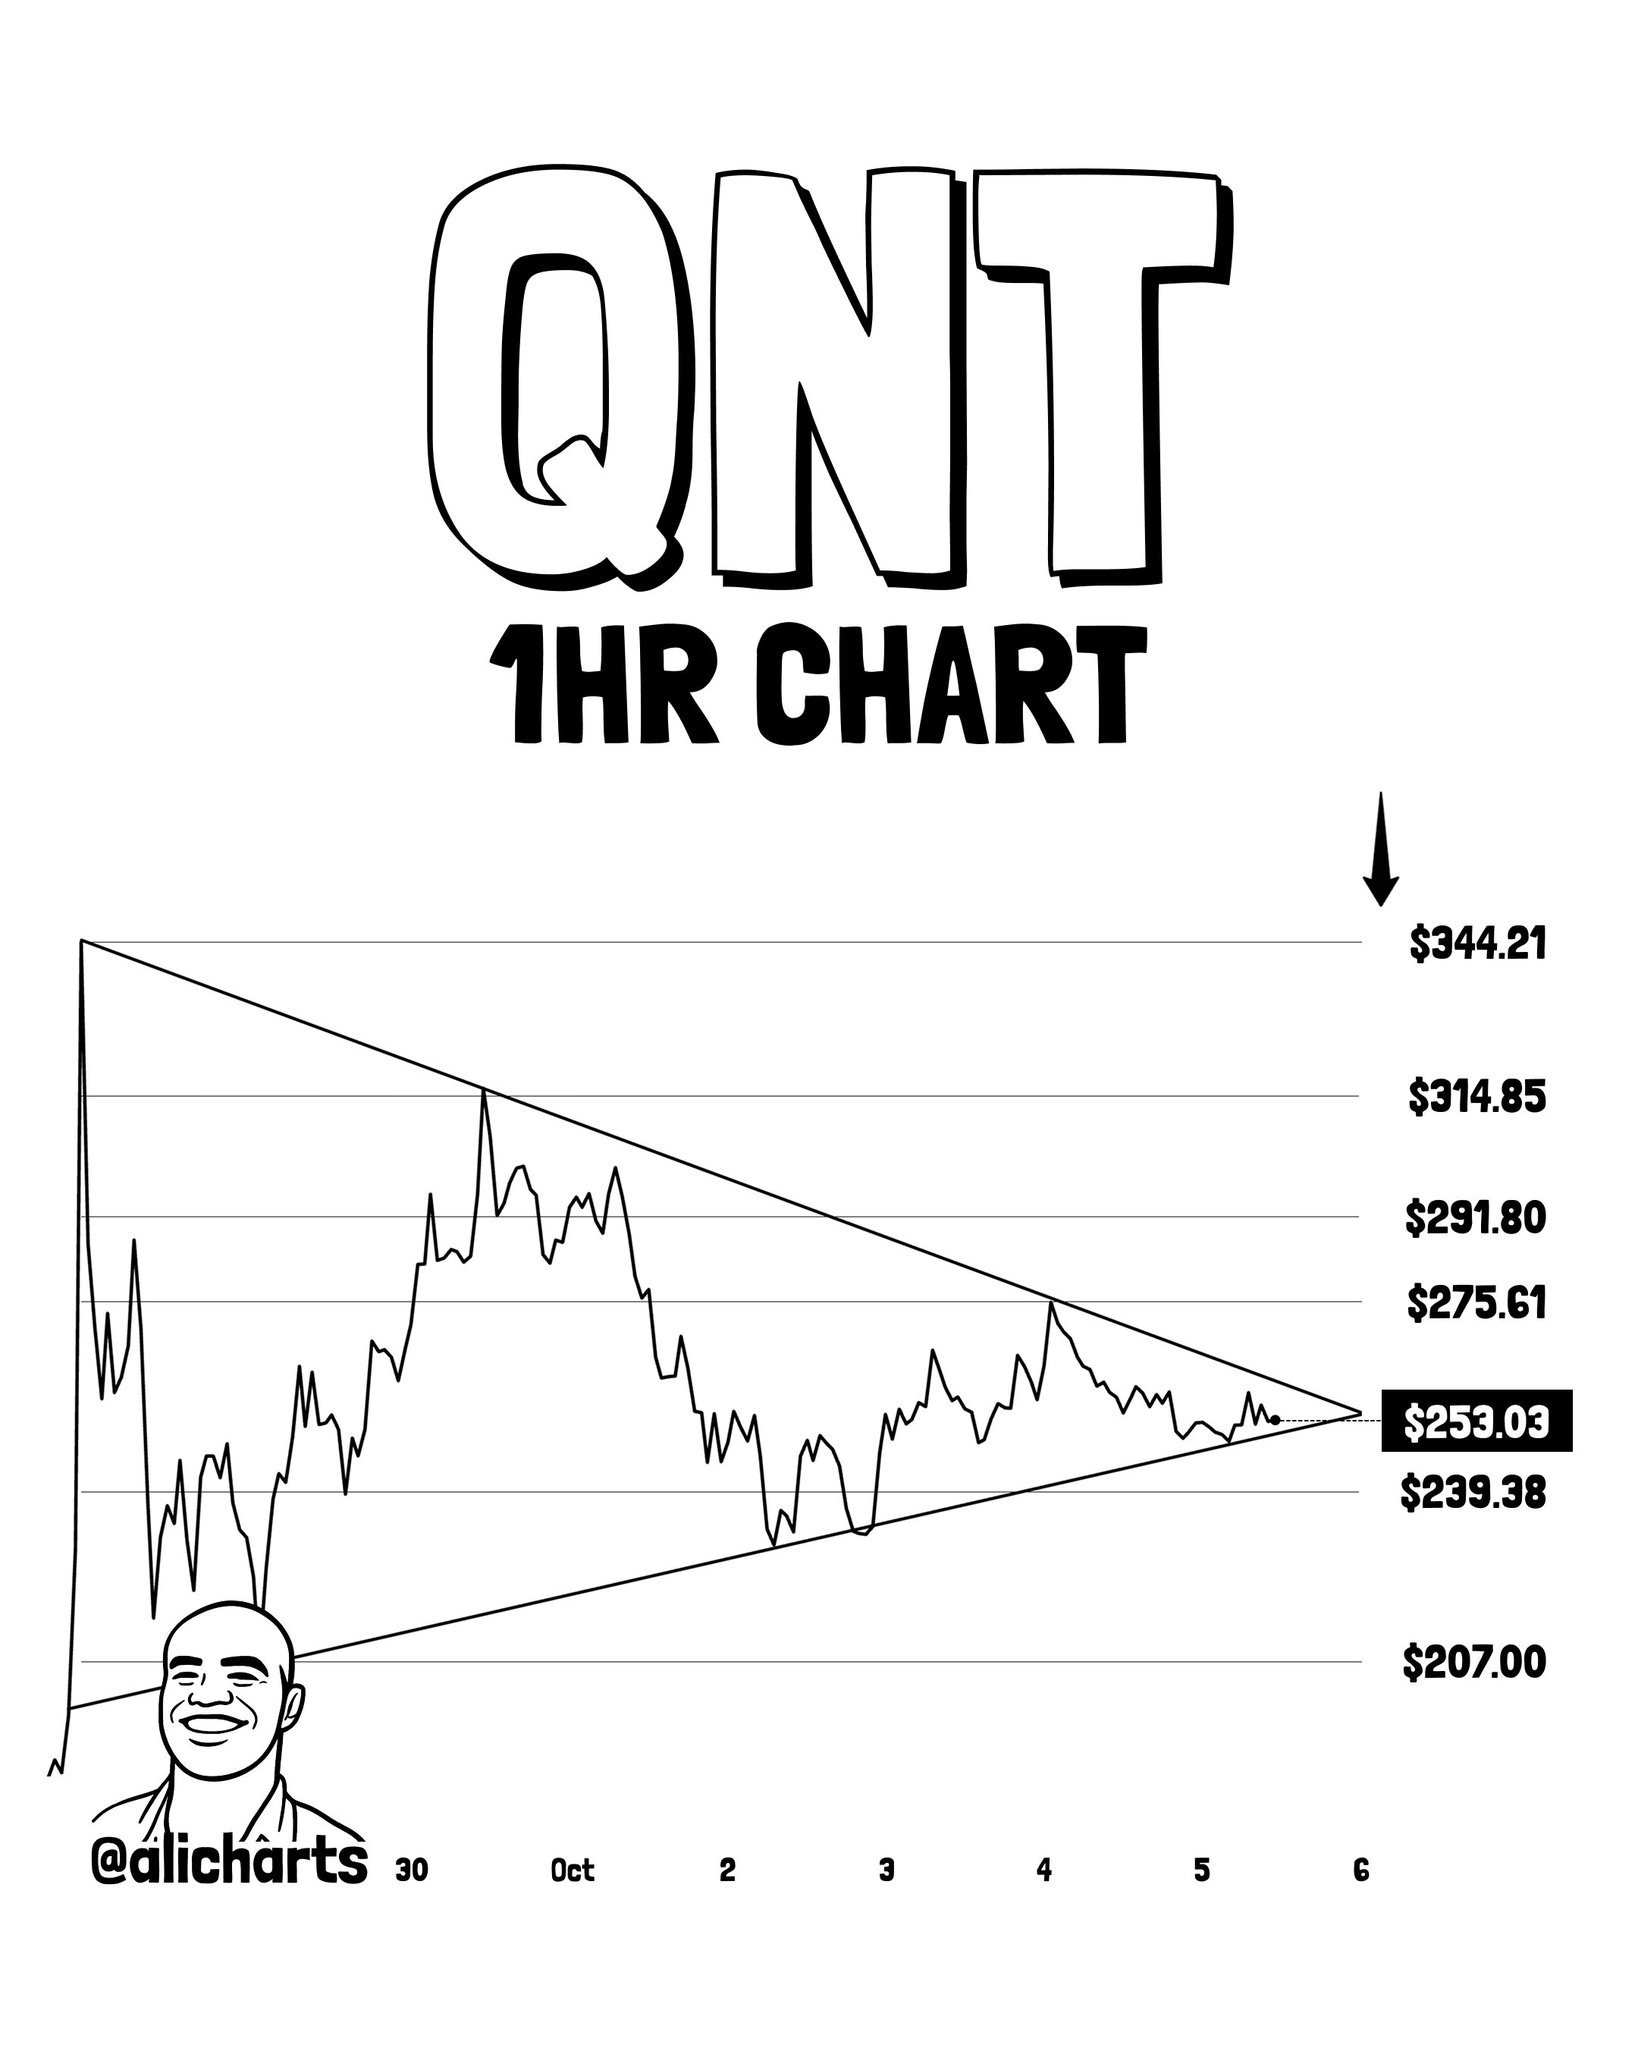
Quant’s one-hour chart tells a different story — not a clean breakout, but a compression reaching its apex. The pattern is a converging wedge or pennant formed between a declining upper resistance line and a rising lower support line, with price squeezed into a narrowing range. At the time of the analysis, QNT was printing approximately $253.03 — the right-edge apex of that compression, highlighted in a black box on the chart.
Source: @alicharts (X)
Ali wrote that QNT has already had a strong month, and that an hourly close above $262 would confirm the breakout he is watching and put $315, then $344, in focus. $262 is not printed on the chart. The chart box is $253.03. The nearby labels are $239.38 below and $275.61, $291.80, $314.85 and $344.21 above. $315 and $344 are his targets. $314.85 and $344.21 are the chart’s versions of those same levels.
Signal 3 — INJ: Cup-and-Handle Retest of Neckline at $7.33
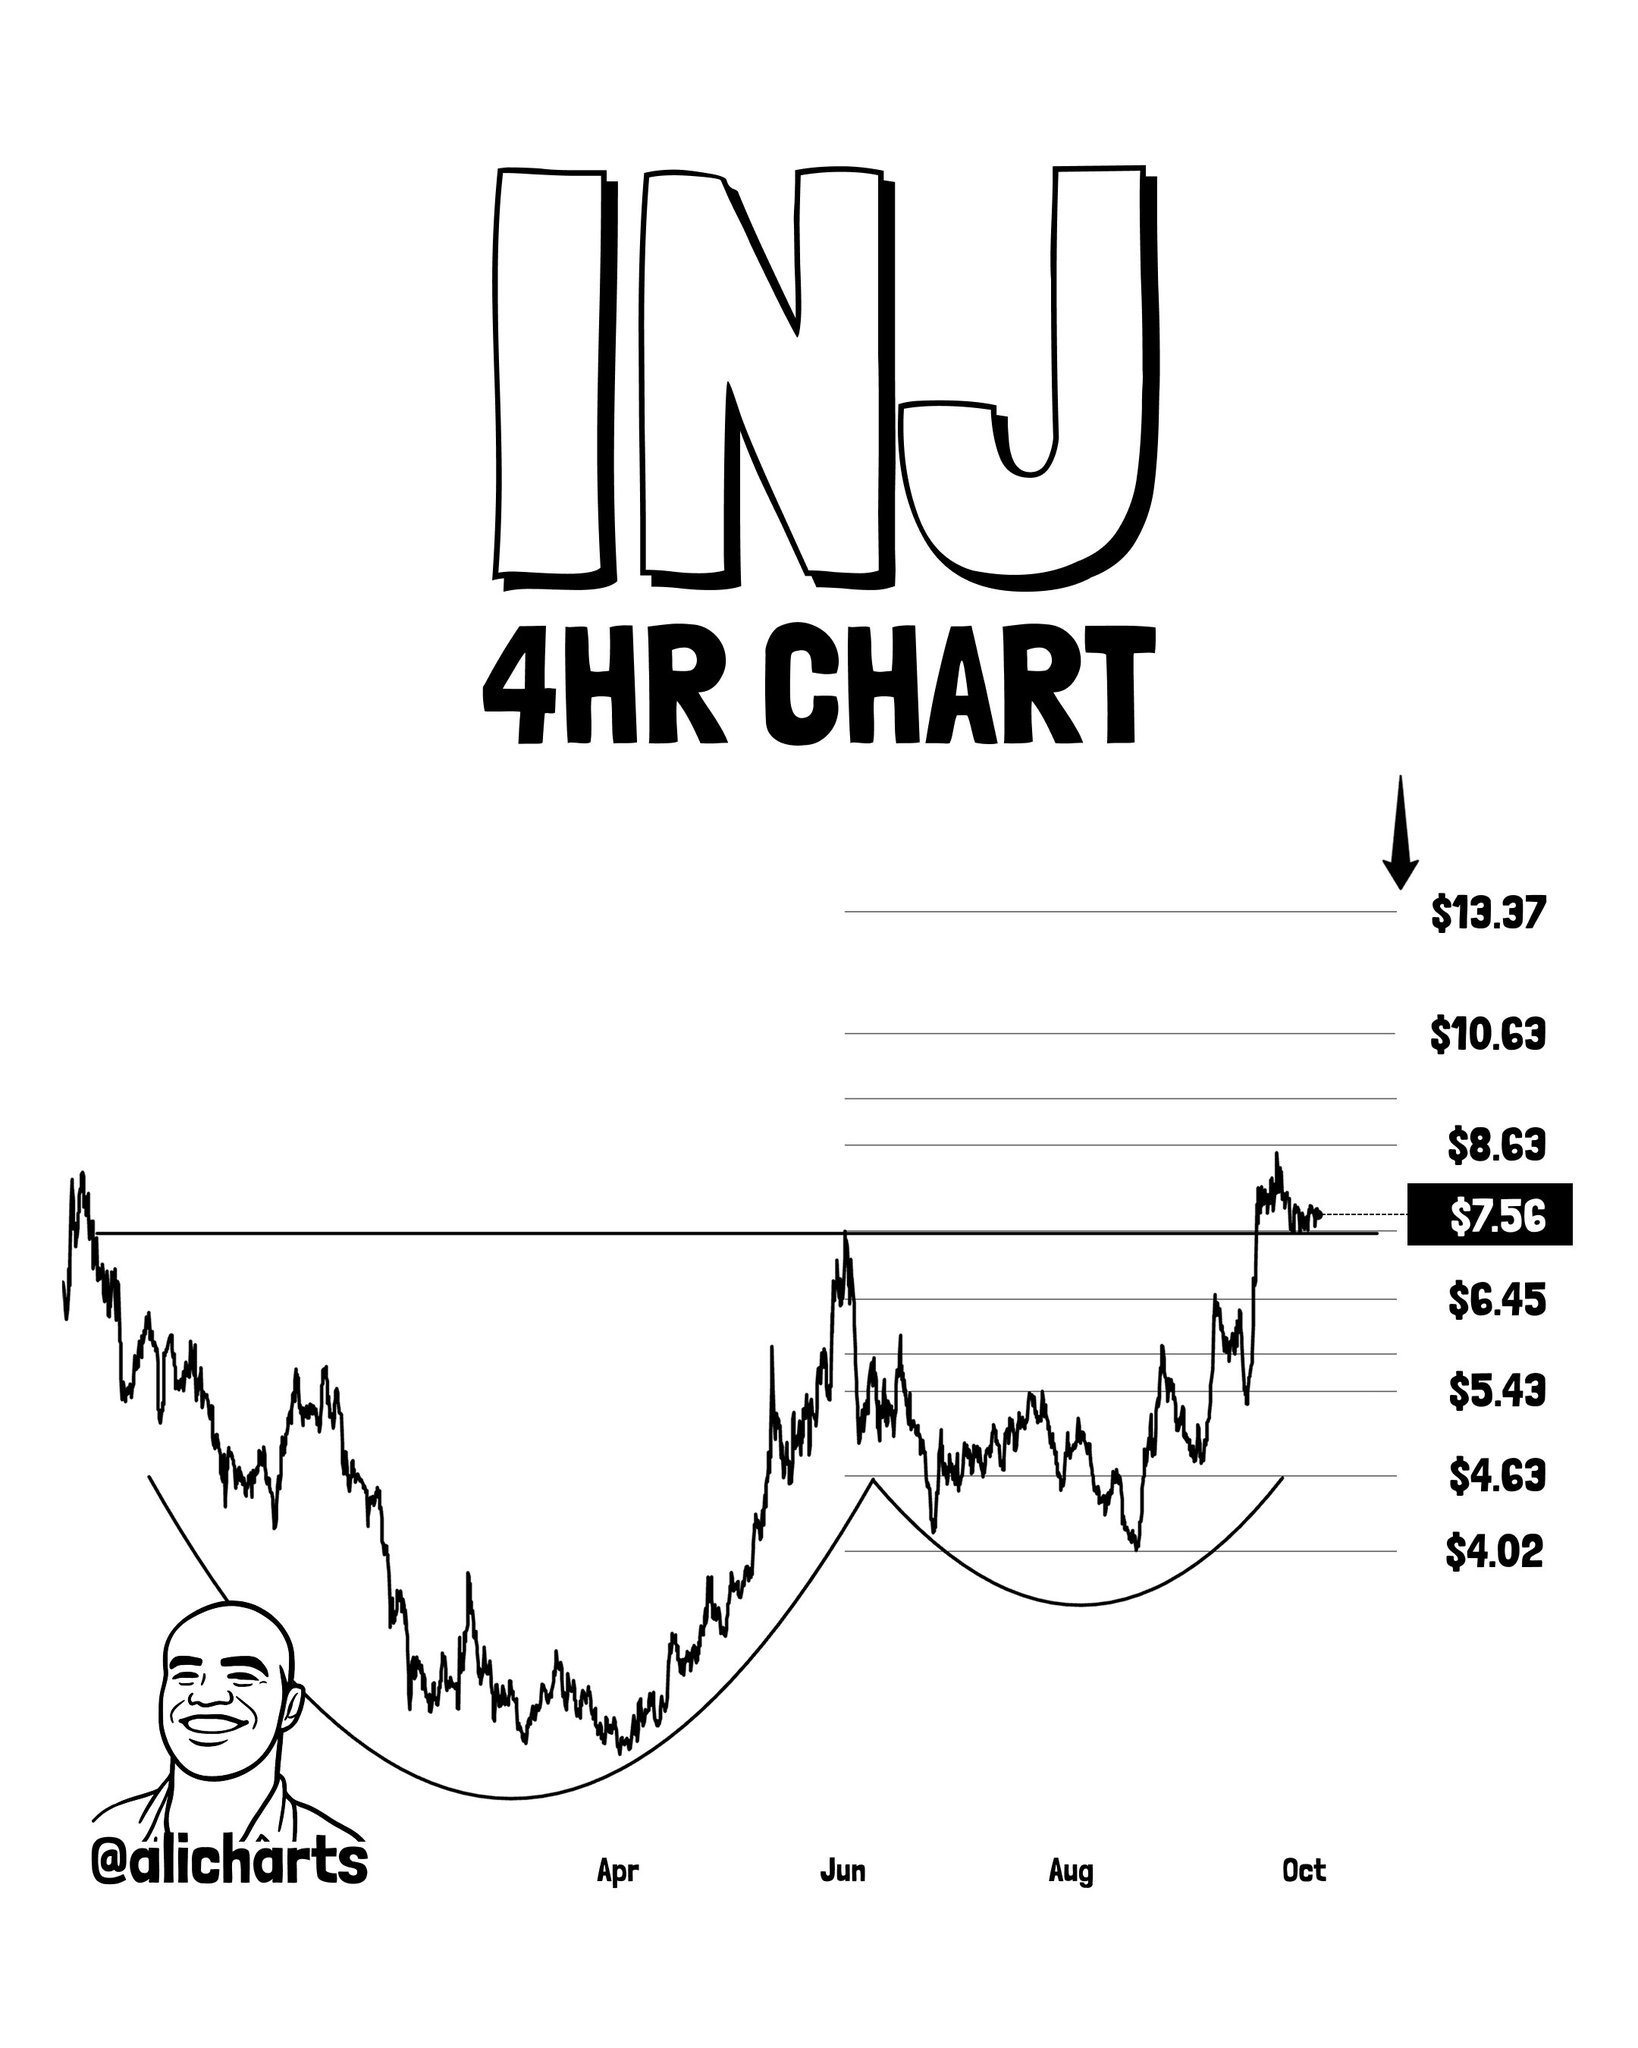
Injective’s four-hour chart presents the largest structural pattern of the three — a cup-and-handle formation spanning approximately April through October. The cup itself is a large U-shaped trough running from roughly April through August, followed by a smaller consolidation forming the handle. The neckline of the pattern runs horizontally across the chart near current price.
Source: @alicharts (X)
Ali wrote that INJ appears to have broken out of a cup and handle and is retesting its neckline near $7.33. If buyers defend that level and momentum picks up, the pattern points toward $13.40. The chart box prints $7.56, not $7.33. The chart’s top label is $13.37, not $13.40. $8.63 and $10.63 are printed between the box and the top label. He did not name those two. He also did not give a level that invalidates the retest.
Three Patterns, One Common Structure
XRP’s condition is a hold of $1.50, with $1.62 in view. QNT’s condition is an hourly close above $262, with $315 then $344 in view. INJ’s condition is buyers defending the neckline near $7.33, with $13.40 in view. The chart boxes are $1.512, $253.03 and $7.56. Ali did not cite the OTHERS index, an EMA50 reclaim, or a 172% rally in this thread.
Bullish Scenario
If $1.50 holds, Ali is watching XRP toward $1.62. An hourly close above $262 would put QNT’s $315, then $344, in focus. If buyers defend INJ near $7.33, his pattern points toward $13.40.
Bearish Scenario
Ali did not publish downside targets. A four-hour close back under $1.50 would miss the condition he set for XRP. A failure to close an hour above $262 would leave the QNT breakout unconfirmed. A failure to defend the INJ neckline near $7.33 would miss the condition he set. $1.470, $239.38 and the labels under $7.56 are chart prints, not his invalidation levels.
Disclaimer: The views and analysis presented in this article are for informational purposes only and reflect the author’s perspective, not financial advice. Technical patterns and indicators discussed are subject to market volatility and may or may not yield anticipated results. Investors are advised to exercise caution, conduct independent research, and make decisions aligned with their individual risk tolerance.