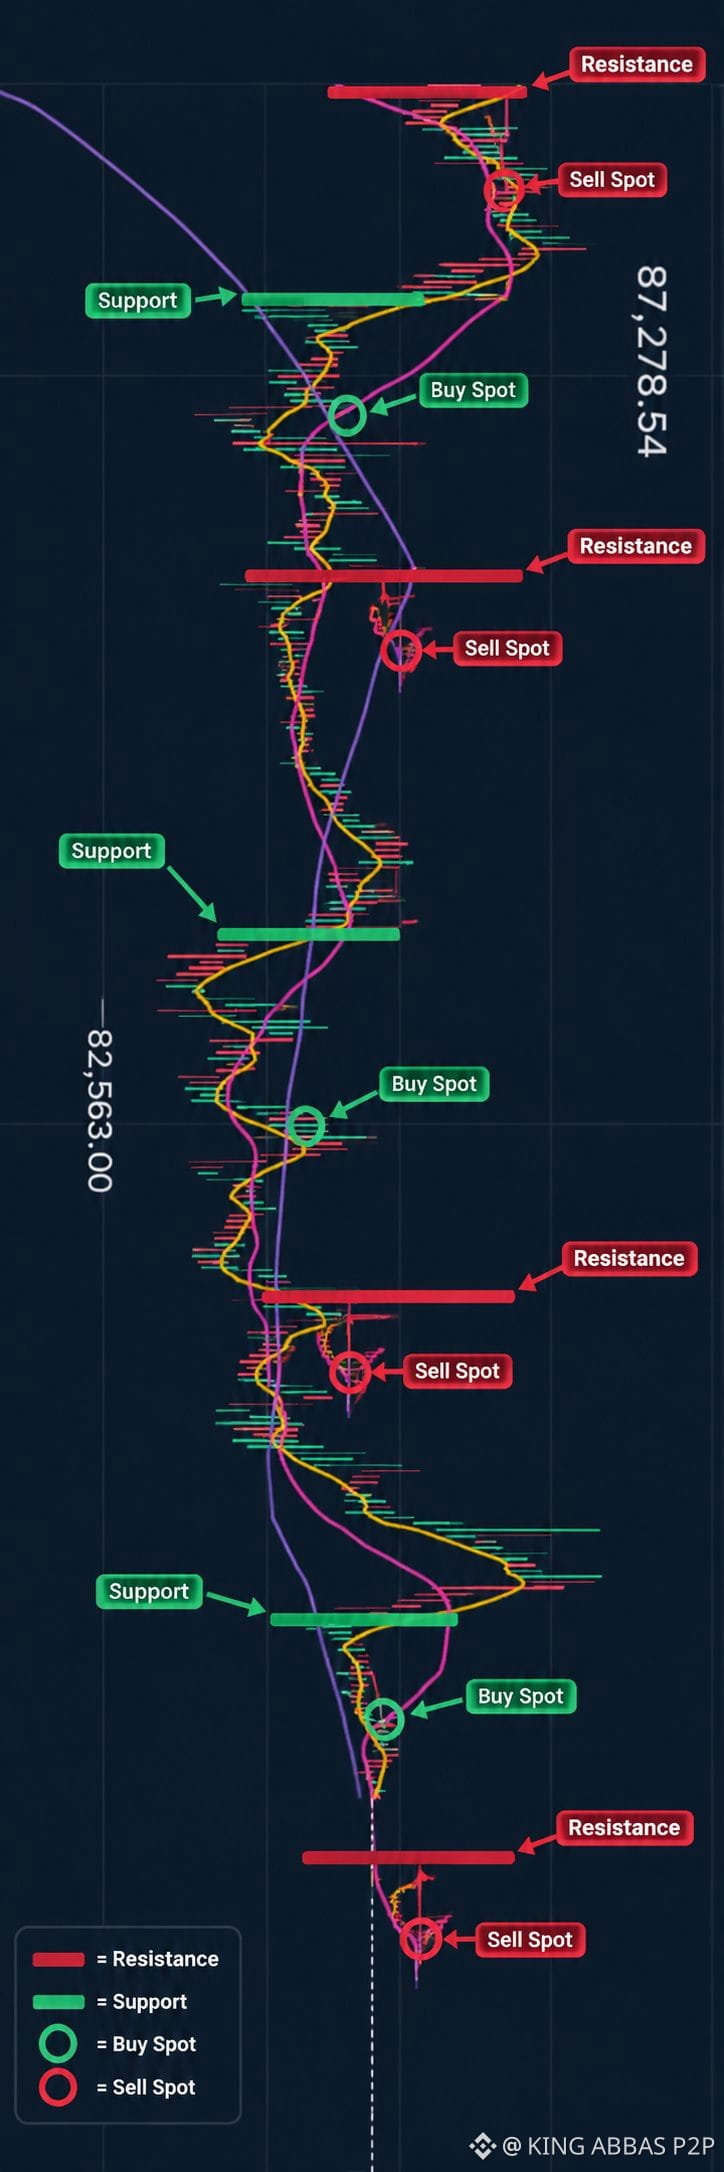
BTC/USDT Chart Study - Support & Resistance Concept (Educational)
Studying the BTC chart today for learning purpose.
Green Line = Support zone (where buyers showed interest before)
Red Line = Resistance zone (where sellers took profit before)
This chart is rotated for better view of levels. This is for education only, not a buy/sell signal. I am learning technical analysis.
What levels are you watching? Share your view 👇
#BTC走势分析 #bitcoin #supportandresistance #ChartStud #cryptoeducation
Studying the BTC chart today for learning purpose.
Green Line = Support zone (where buyers showed interest before)
Red Line = Resistance zone (where sellers took profit before)
This chart is rotated for better view of levels. This is for education only, not a buy/sell signal. I am learning technical analysis.
What levels are you watching? Share your view 👇
#BTC走势分析 #bitcoin #supportandresistance #ChartStud #cryptoeducation