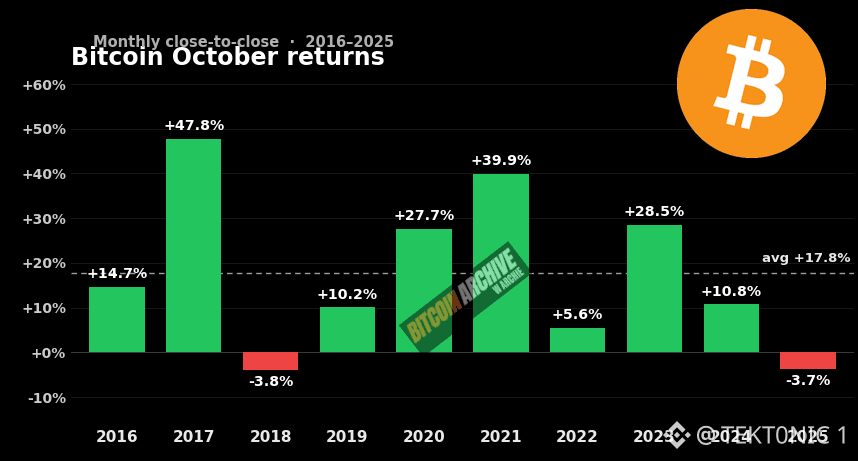
Bitcoin’s average October return is about +17.8% on this chart, measured close to close from 2016 through 2025. From about $83,400, that average would put price near $98,400. eight of those ten Octobers finished green for $BTC . 2017 was +47.8%. 2021 was +39.9%. 2023 was +28.5%. The two red Octobers were small, 2018 at −3.8% and 2025 at −3.7%. The average is lifted by those two large years. The middle of the set sits closer to +10% than to +18%. this October has just started, and last year’s October already showed the average can fail. Price has reclaimed $86,000 after a 42.6% third quarter, the best Q3 since 2017. Spot ETFs took in about $6.3 billion in that quarter, then the nine-day inflow streak broke on the last session of September. repeating the average is arithmetic, not a forecast. A +10% month from here is about $92,000. A +18% month is about $98,400. Kalshi still prices a trade through $100,000 by year-end near 40%, which is a crowd bet, not the base case. the month turns on whether $BTC holds $86,000. A green October needs ETF flows to stay positive and the weekly close to hold the breakout. The average is the history. It does not set this month’s close. #BTC Price Analysis# #Bitcoin Price Prediction: What is Bitcoins next move?# $XRP #Bullish


投稿