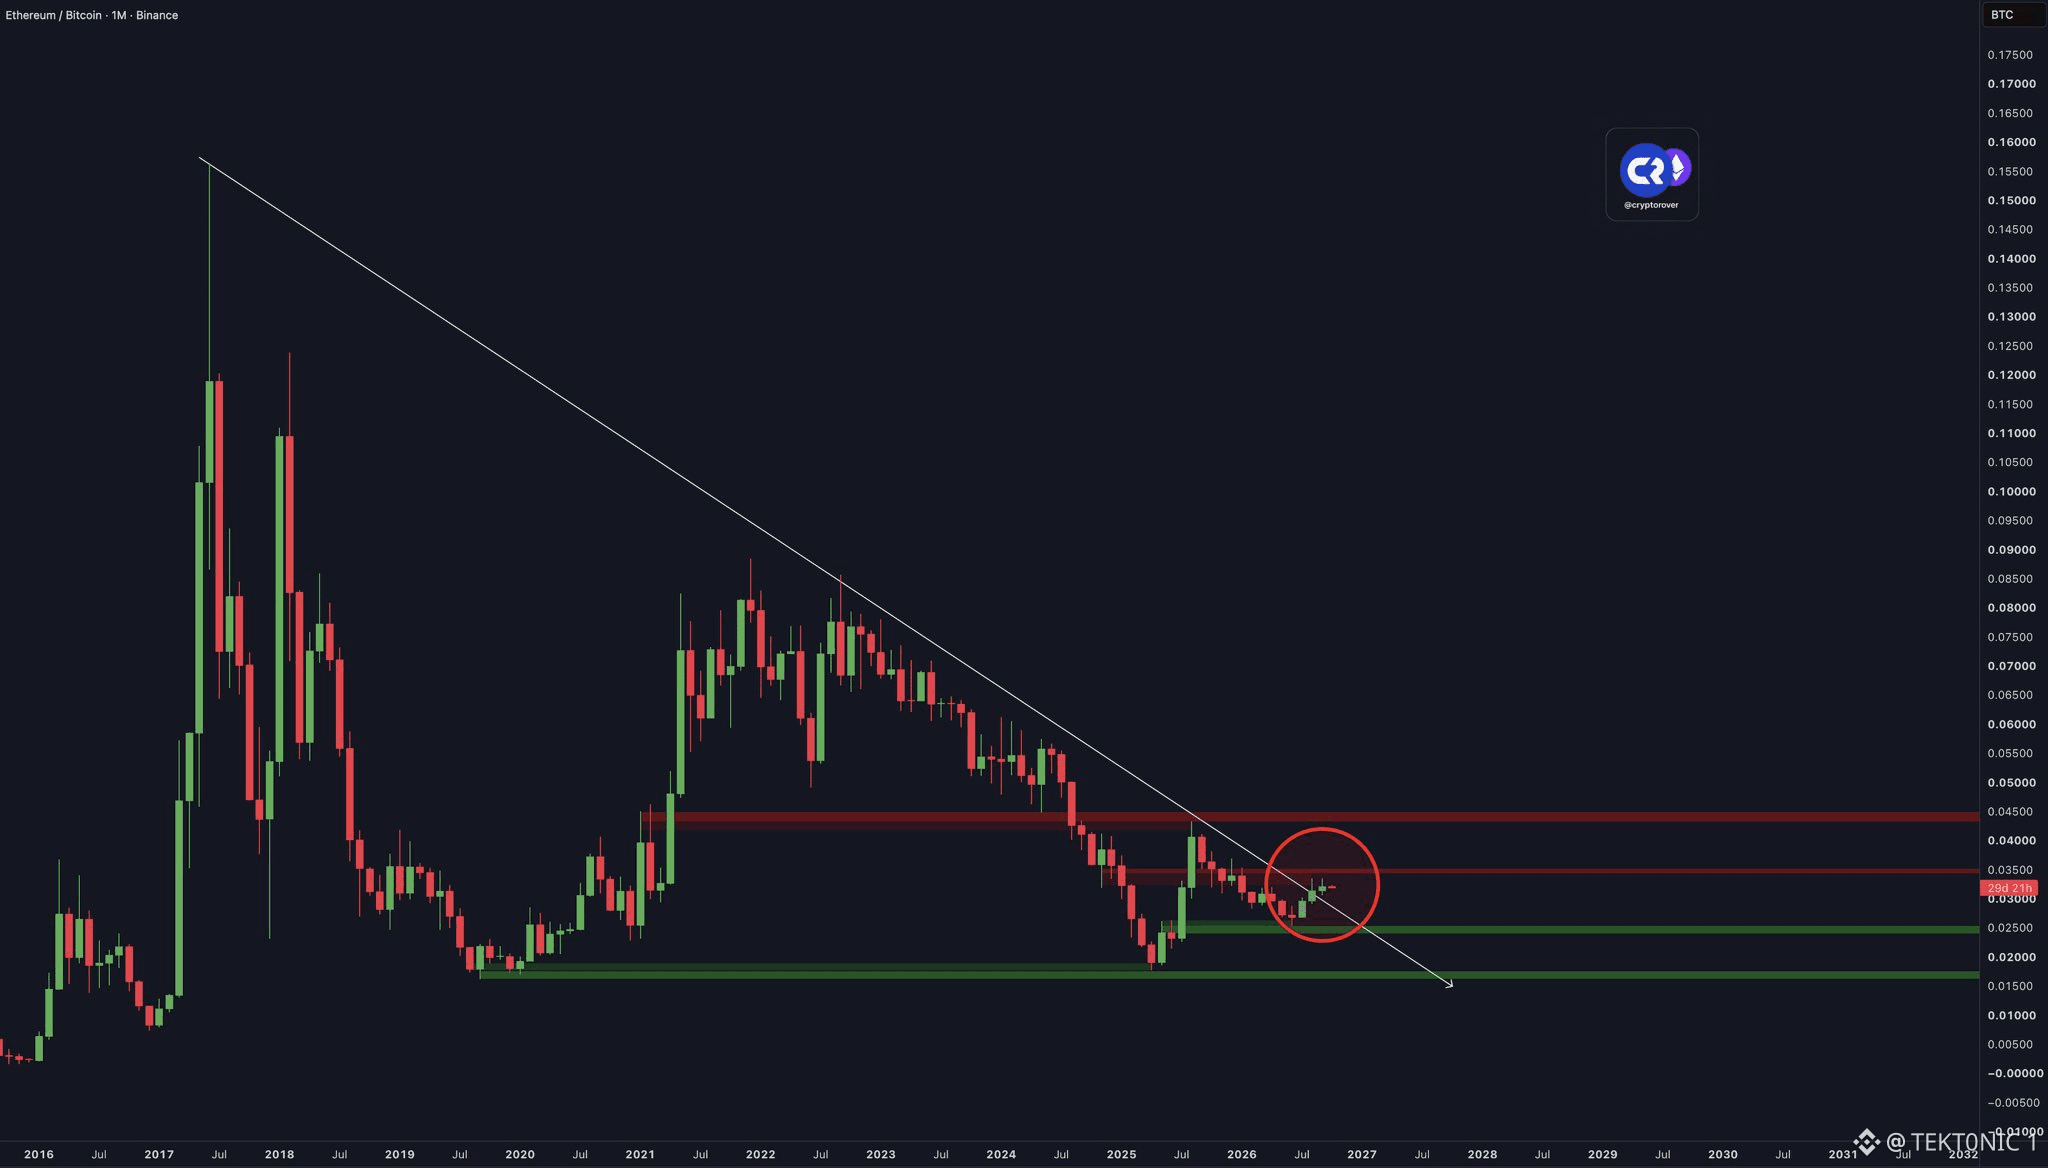
$ETH against $BTC just pushed through a descending trendline that has capped the pair since 2017. That is the nine-year monthly break traders have been waiting on. The pair is near 0.032, after failing at 0.0334 in August and again in mid-September. Q3 already showed the shift. Ether gained about 67% to 71%. Bitcoin gained 42.6%. Spot ether ETFs took in about $3 billion in the quarter after outflows in Q2. The ratio matters more than either dollar chart, because a higher $ETH /$BTC pair is how capital rotates out of Bitcoin and into Ether. the dollar price has not followed the chart. Ether is still near $2,700, and $2,750 to $2,800 has been the area it keeps failing. Bitcoin is near $86,000. A ratio break can extend while both assets stay range-bound if Bitcoin is the one giving ground. a monthly close above the 2017 trendline, and a hold over 0.0334, is what keeps this break alive. Lose that trendline and it was a wick. Hold it and the pair has space it has not had since the last cycle. That is the trade. The chart is already there.


投稿