



On October 2, 2026, SAND/USDT surged to 0.05777, sending Sandbox crypto into extreme overbought territory on every timeframe. RSI readings border on exhaustion, yet momentum indicators show no breakdown so far.
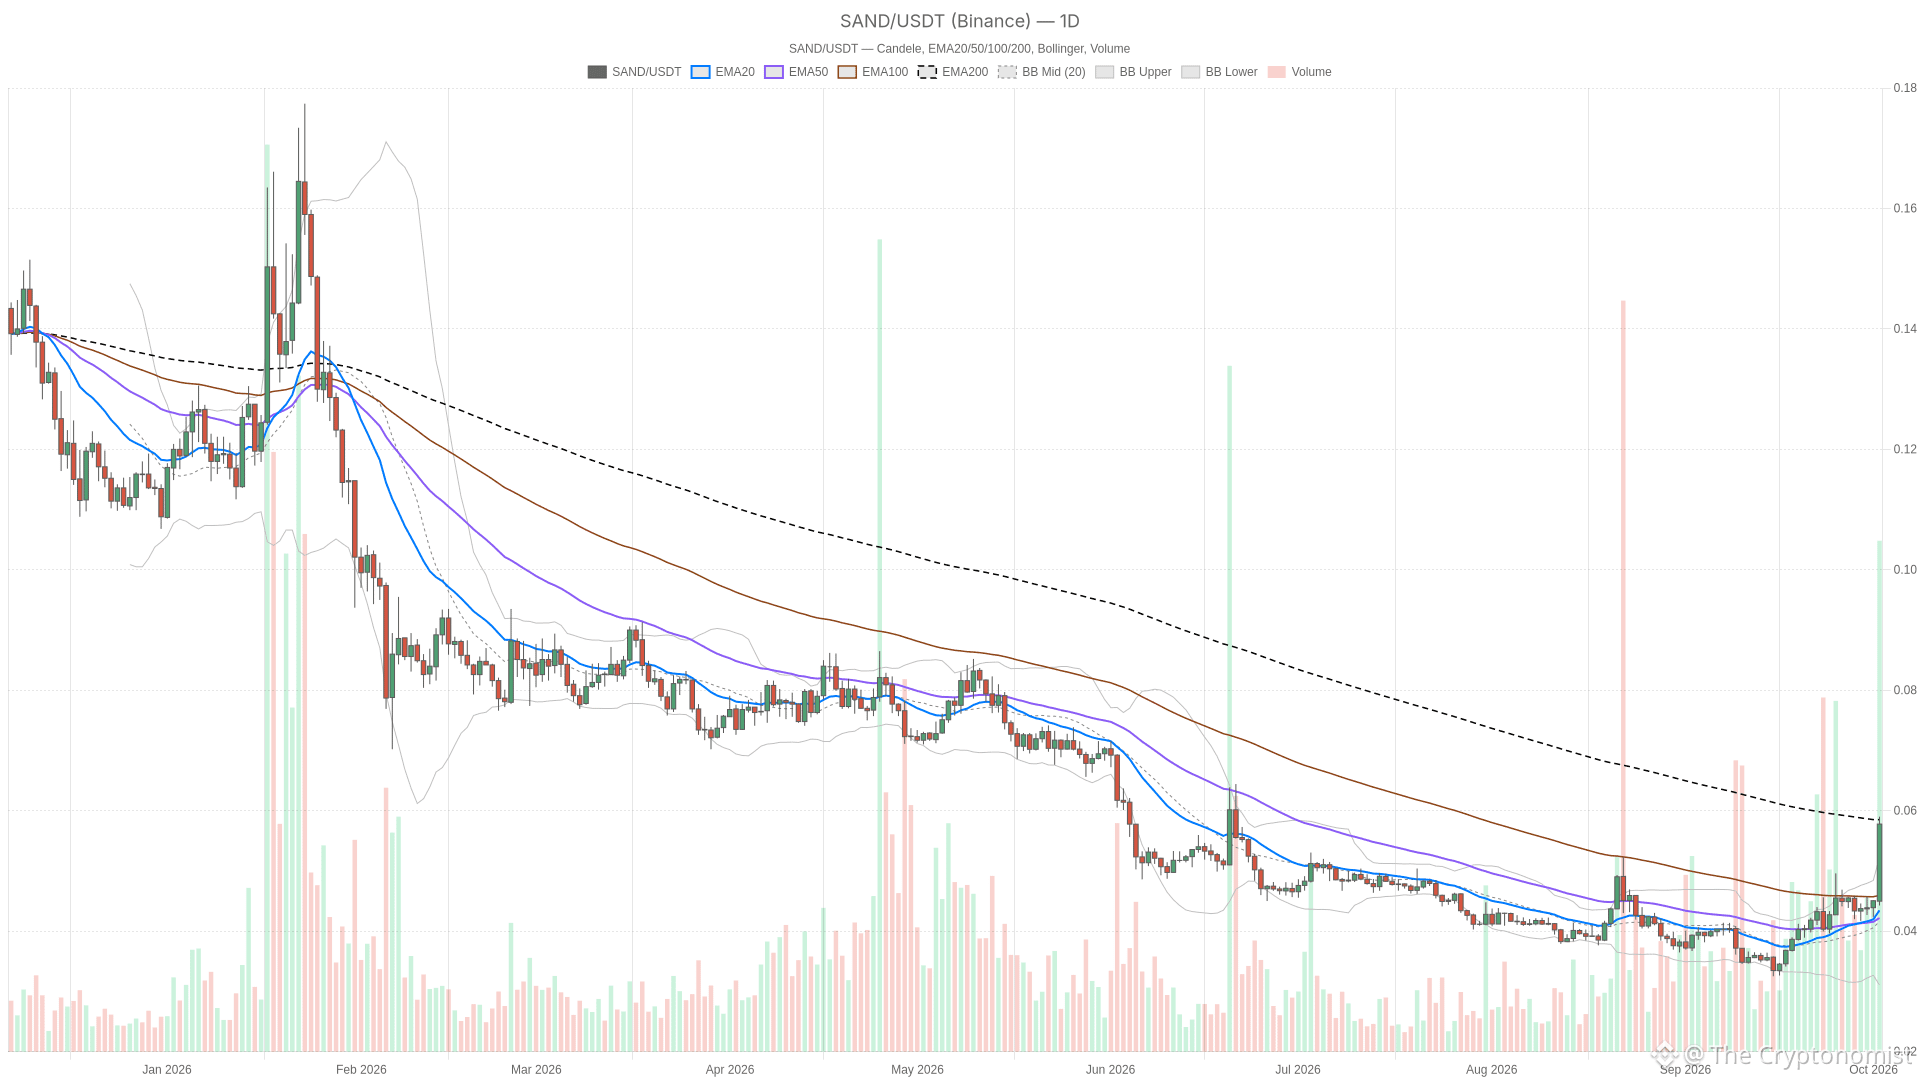 SAND/USDT — daily chart with candlesticks, EMA20/EMA50 and volume.
Key takeaways
SAND/USDT trades at 0.05777, with daily RSI14 reaching 77.62 — deep into overbought territory.
Price is stretched outside the daily upper Bollinger Band at 0.052236, signaling overextension.
The EMA200 at 0.058513 remains unclaimed, keeping the longer-term trend technically unconfirmed.
Shorter timeframes show even more extreme readings: 1H RSI14 at 91.01 and 15m RSI14 at 96.98.
Total crypto market cap sits at $2.93 trillion, down 1.49%, with Bitcoin dominance at 58.76%.
Daily Chart: A Breakout Still Fighting Its Long-Term Trend
The daily chart shows genuine upward momentum, but the longer-term structure remains unresolved. SAND closed at 0.05777, comfortably above both the EMA20 (0.043453) and EMA50 (0.042184). However, price sits just below the EMA200 at 0.058513. The broader trend has not technically reversed yet. As a result, the system still tags the daily regime as neutral rather than outright bullish.
The daily RSI14 at 77.62 sits deep in overbought territory. The MACD line (0.0025894) remains well above its signal (0.0013427), and a rising histogram (0.0012467) confirms genuine positive momentum. The Bollinger Bands, however, tell a cautionary tale. With the upper band at 0.052236 and price at 0.05777, SAND is stretched outside its own volatility envelope. This is a classic overextension signal — not a sell trigger, but a warning that the pace is unsustainable. Daily ATR14 of 0.0041814 confirms volatility has expanded significantly.
1H and 15M: Momentum Says Bullish, But It’s Running Hot
The 1H chart removes any ambiguity about near-term direction. EMA20 (0.046205), EMA50 (0.044896) and EMA200 (0.043819) are all stacked bullishly beneath the current price of 0.05768. The regime flag reads outright bullish. The problem is the RSI14 at 91.01, an extreme reading that almost never persists without at least a sharp intraday cooldown. MACD on the 1H (line 0.001643 vs signal 0.0006276) is still pushing higher. Momentum has not broken down. However, price trading above the 1H upper Bollinger Band (0.05148) echoes the same overextension story seen on the daily.
Zooming into the 15-minute chart, the RSI14 reads 96.98 — about as extreme as this indicator gets. MACD remains positive here too, and the EMA stack backs the bullish regime label. For execution purposes, the immediate trend is still up. Yet entries chasing strength at these RSI levels carry real mean-reversion risk. The 15m pivot structure is tight: pivot 0.057167, resistance 0.059333, support 0.055333. This fits a market that is extended and likely to chop before deciding on a real direction.
Where the Tension Lies
This is where Sandbox crypto creates a genuine dilemma for traders. The timeframes do not fully agree on conviction, even if they agree on direction. The daily chart confirms upward momentum but keeps price below the EMA200, flagging the move as an unconfirmed reversal. The 1H and 15m charts are unambiguously bullish in regime. Yet they carry RSI readings so extreme — 91 and 97 — that they flash exhaustion rather than strength. The dominant force remains momentum-driven buying pressure. However, it lacks the EMA200 reclaim that would make this a lower-risk trend trade rather than a chase.
Bullish Scenario
If SAND can hold above the daily pivot at 0.05368 and eventually close convincingly above the EMA200 (0.058513), that would mark a genuine structural shift. The daily R1 at 0.06309 then becomes the next logical magnet. The 1H R1 at 0.061823 reinforces that zone as a cluster of resistance worth watching. This scenario needs the extreme RSI readings to cool off through sideways consolidation rather than a sharp price drop. A healthy digestion pattern would be far more constructive than a violent reversal.
What would invalidate the bullish case: a daily close back below the EMA200 and the 0.05368 pivot. That would suggest the breakout failed to hold. The move would then fall back into the context of elevated volatility within a broader range, rather than a trend change.
Bearish Scenario
Given RSI14 readings between 77 and 97 across all three timeframes, a pullback toward the mean is a reasonable base case. Price is trading outside the upper Bollinger Bands on both the daily and 1H charts. On the daily, a retracement toward the BB mid (0.041641) or the S1 pivot at 0.04836 would not be surprising. On the 1H, the EMA20 at 0.046205 and S1 at 0.050713 represent the first real support tests if momentum fades.
What would invalidate the bearish case: if price holds above the 1H EMA20 and daily pivot through any pullback. MACD histograms staying positive would suggest buyers are absorbing profit-taking rather than losing control. That would effectively kill the mean-reversion thesis.
Final Take
SAND/USDT right now is a textbook case of strong momentum colliding with stretched conditions. The daily chart has not confirmed a full trend reversal, as price remains under the EMA200. Meanwhile, the 1H and 15m charts scream bullish regime with RSI levels that are historically unsustainable. Volatility, as measured by ATR readings across timeframes, has expanded meaningfully. Moves in either direction could be sharp and fast. This setup does not reward complacency in either direction. The extreme RSI readings deserve respect, and so does the fact that momentum indicators have not broken down yet. Position sizing and awareness of the pivot levels outlined above matter more here than conviction in a single outcome.
FAQ
What does the extreme RSI reading mean for SAND/USDT?
The daily RSI14 at 77.62 and 1H RSI14 at 91.01 indicate severe overbought conditions across multiple timeframes. These levels rarely persist without at least a pullback or a period of sideways consolidation. That said, overbought RSI alone is not a sell signal — it simply warns that the pace of the move is unsustainable without a cooldown.
Can SAND break above the daily EMA200?
SAND is trading at 0.05777, just below the EMA200 at 0.058513. A convincing daily close above this level would mark a structural trend reversal and shift the long-term outlook. Until that happens, the daily regime remains neutral despite strong short-term momentum pushing price higher.
What are the key support levels to watch for SAND/USDT?
On the daily chart, the first support is the pivot at 0.05368, followed by S1 at 0.04836 and the Bollinger Band mid at 0.041641. On the 1H chart, the EMA20 at 0.046205 and S1 at 0.050713 represent the first real tests if momentum begins to fade. A hold above these levels through any pullback would suggest buyers remain in control.
Disclaimer: This article is for informational purposes only and does not constitute financial advice, an investment recommendation, or a solicitation to buy or sell any financial instrument or cryptocurrency. The analysis provided is not indicative of future results. Investing in crypto assets and financial markets carries a high risk of capital loss. Always do your own research (DYOR) and consult a qualified financial advisor before making any decision.
Article produced with the assistance of artificial intelligence and reviewed by the editorial team.