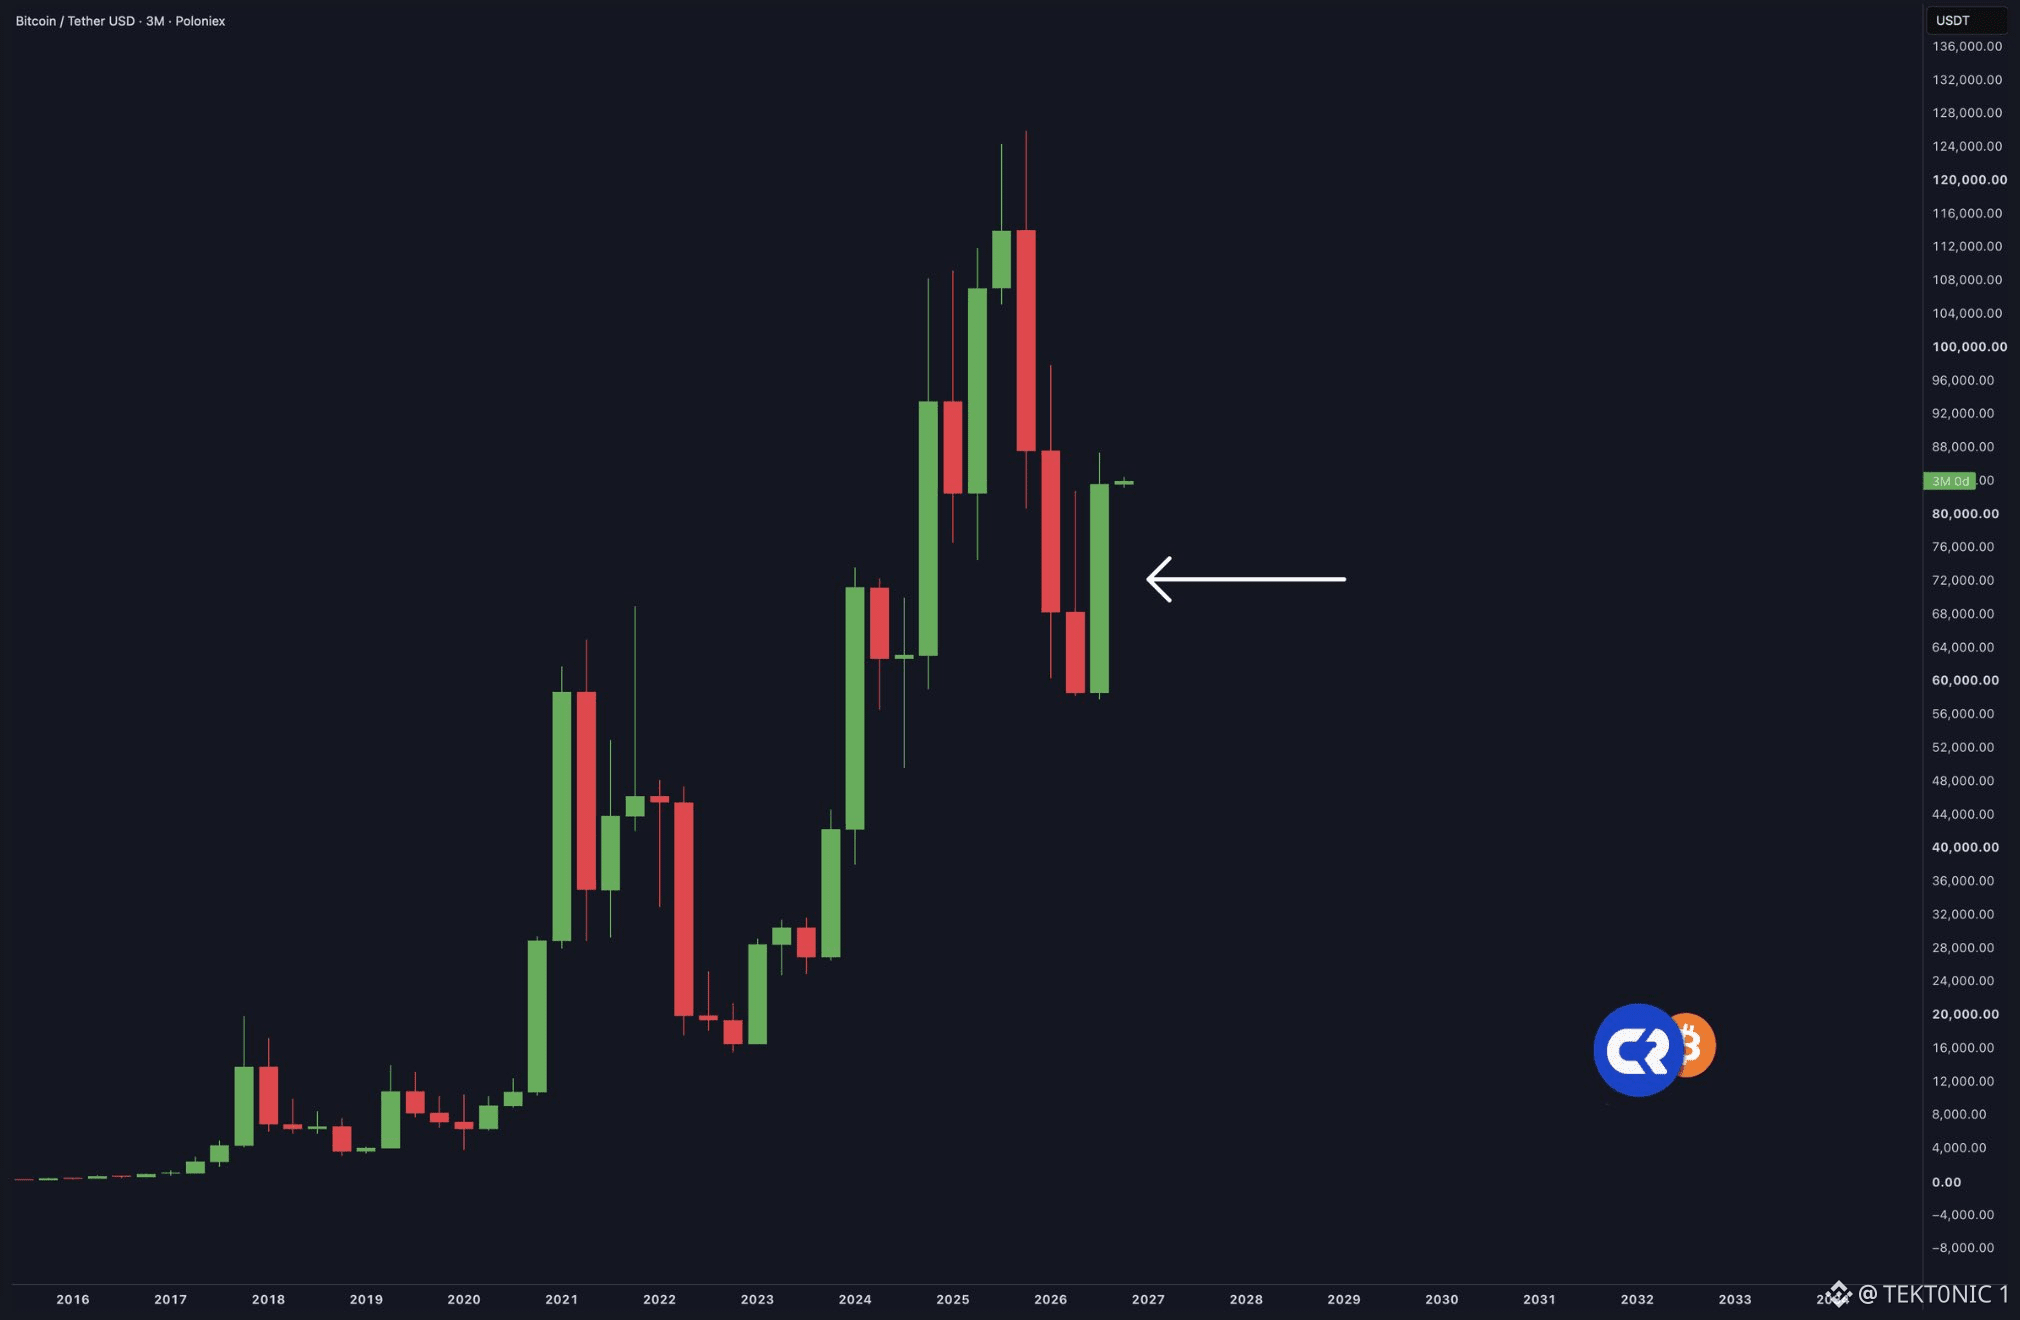
$BTC just closed a quarter that took back most of the prior six months. On the 3-month chart, the latest candle is green after two red ones. Q1 was −22.1%. Q2 was −14.1%. Together that was about a 33% hole from the start of the year to the end of June, with price near $58,600. Q3 then gained 42.6%, the best third quarter since 2017, and price finished near $84,000. That is the candle the arrow is pointing at. the recovery is real. It is not a full reset. A 33% drop needs about a 50% rebound to get back to the same price. 42.6% does not clear that. The year is still slightly red. The 2025 high near $126,000 is still well above this candle. a 3-month $BTC candle hides the path. August did most of the work. September only added about 6%. Spot ETFs took in about $6.3 billion in the quarter, then the nine-day inflow streak broke on the last session. a green quarter after two red ones is a repair, not a new high. Watch whether October holds $84,000 and whether the next 3-month candle builds on this one. The pain of the first half is mostly retraced. It is not erased. #BTC Price Analysis# #Bitcoin Price Prediction: What is Bitcoins next move?# $XRP #Bullish


投稿