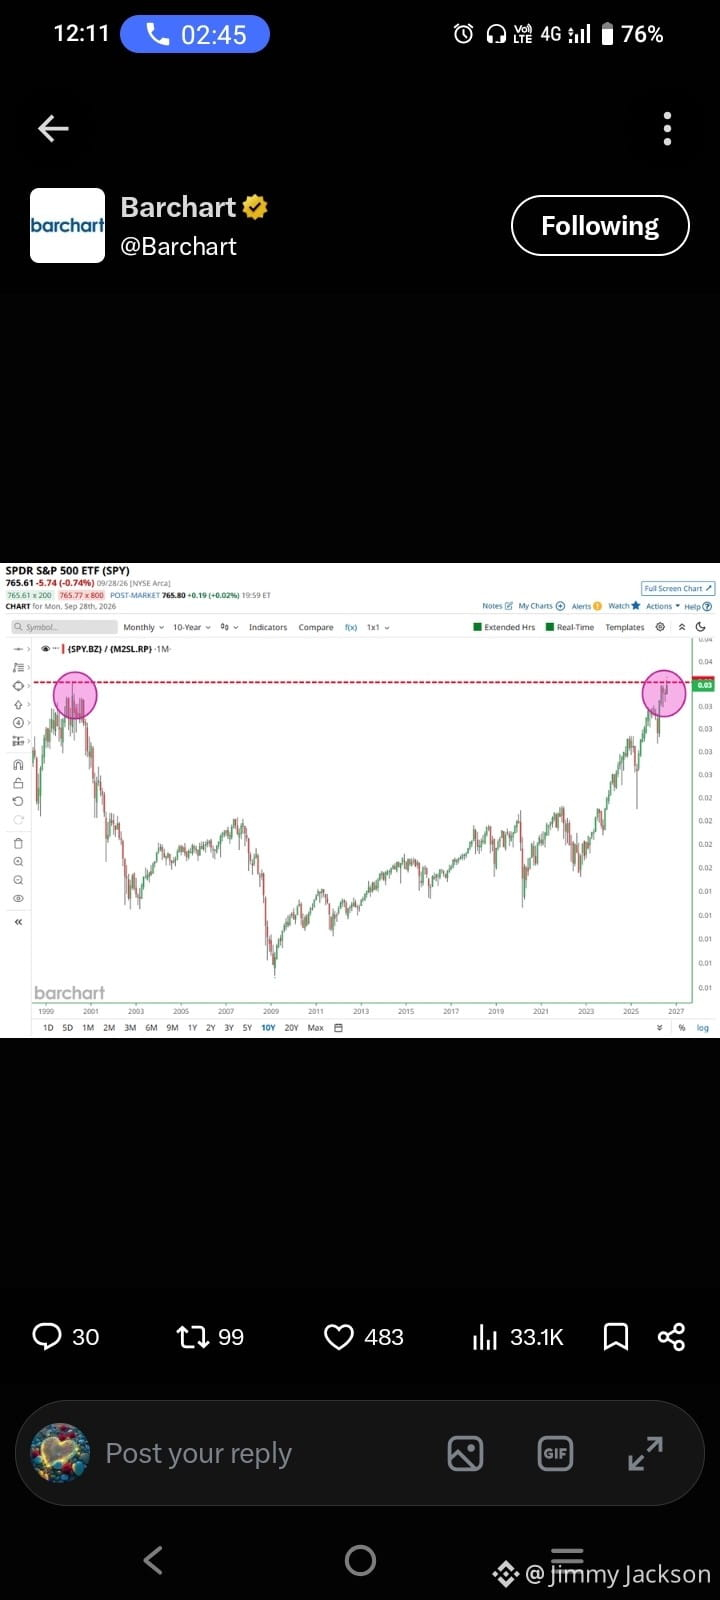
🚨 The Stock Market Just Crossed a Line We Haven't Seen Since the Dot-Com Era 🚨
$BTC
Something big just happened, and most people aren't paying attention.
The S&P 500, when you measure it against the total amount of money sloshing around in the economy (that's M2 money supply for those keeping score), has now climbed past a threshold we last hit at the absolute peak of the Dot-Com Bubble. 📈
$SSV
Let that sink in for a second.
Back in 2000, this same ratio flashed a warning sign right before the Nasdaq cratered and investors lost trillions. Today, we're sitting above that level again. Now, before anyone panics, it's worth noting that this isn't a perfect timing tool. Markets can stay irrational far longer than anyone expects, and this ratio has been climbing for years thanks to aggressive money printing and a relentless bull run in equities. 💰
But here's the thing that makes this worth your attention: it tells us that stock prices have run way ahead of the actual money circulating in the system. In plain English? Valuations are stretched thin. When the gap between market cap and money supply gets this wide, history suggests the rubber band eventually snaps back.
$JILL.US
Does that mean a crash is guaranteed tomorrow? Absolutely not. But it does mean the margin of safety is razor thin, and smart investors should be paying attention to risk management right now, not chasing every rally like it's 1999. 🧠
Stay sharp out there.
Please don’t forget to like, follow, and share! 🩸 Thank you so much ❤️
#BitMineETHHoldingsTop6Million #StrategyAdds1666BTCHoldingsReach847666 #OpenAIDelaysGPT6.1OverSafetyIssues #HackersDrainOver12.4MXRPFromDCENTWallets #UKFCAWinsCourtOrderToRecover851400Pounds
$BTC
Something big just happened, and most people aren't paying attention.
The S&P 500, when you measure it against the total amount of money sloshing around in the economy (that's M2 money supply for those keeping score), has now climbed past a threshold we last hit at the absolute peak of the Dot-Com Bubble. 📈
$SSV
Let that sink in for a second.
Back in 2000, this same ratio flashed a warning sign right before the Nasdaq cratered and investors lost trillions. Today, we're sitting above that level again. Now, before anyone panics, it's worth noting that this isn't a perfect timing tool. Markets can stay irrational far longer than anyone expects, and this ratio has been climbing for years thanks to aggressive money printing and a relentless bull run in equities. 💰
But here's the thing that makes this worth your attention: it tells us that stock prices have run way ahead of the actual money circulating in the system. In plain English? Valuations are stretched thin. When the gap between market cap and money supply gets this wide, history suggests the rubber band eventually snaps back.
$JILL.US
Does that mean a crash is guaranteed tomorrow? Absolutely not. But it does mean the margin of safety is razor thin, and smart investors should be paying attention to risk management right now, not chasing every rally like it's 1999. 🧠
Stay sharp out there.
Please don’t forget to like, follow, and share! 🩸 Thank you so much ❤️
#BitMineETHHoldingsTop6Million #StrategyAdds1666BTCHoldingsReach847666 #OpenAIDelaysGPT6.1OverSafetyIssues #HackersDrainOver12.4MXRPFromDCENTWallets #UKFCAWinsCourtOrderToRecover851400Pounds