Seeing every new tokenized asset called RWA adoption doesn't sit right. Issuance ≠ adoption.
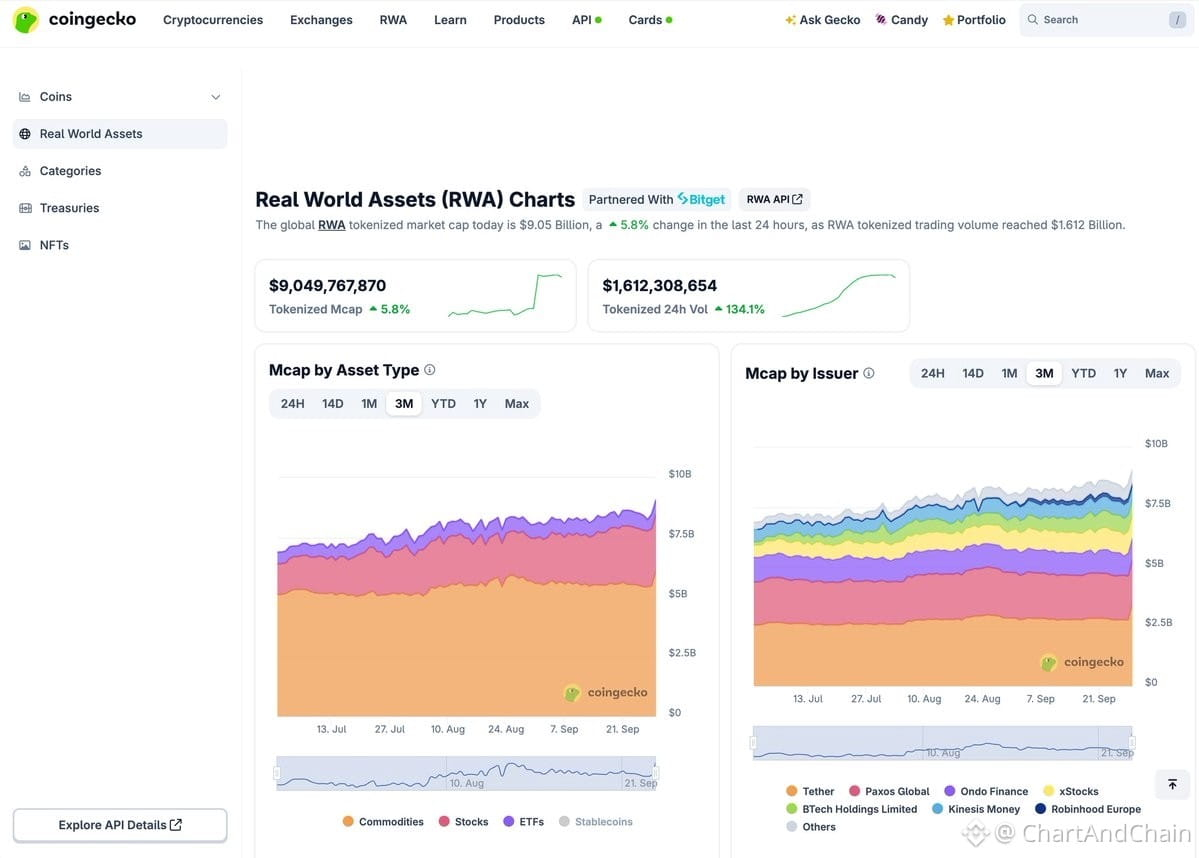
Pulled CoinGecko's RWA charts. Tokenized RWA market cap: $9.04B (+6.3% / 24H). Trading volume: $1.64B (+148.2% / 24H).
That's ~18% of total market cap moved in one day.
Volume is accelerating way faster than the value being tokenized. Asset base grows, but activity is spiking harder.
Doesn't mean the whole RWA market is liquid. Could be one asset or issuer driving most of it.
How to read it:
→ Compare market cap by asset type
→ Check if volume follows the same category
→ Switch to issuer view — who controls the activity?
→ Use token count to separate real demand from just adding more listings
→ Move between 24H / 3M / 1Y / Max to see if it's temporary or structural
If token count rises but volume per asset stays weak = supply expansion, not adoption.
If market cap, volume, and issuer activity all grow together across longer timeframes = stronger signal.
Current volume spike is worth investigating. Asset-type and issuer breakdown will show if it's broad RWA growth or concentrated activity in one corner.
More assets tokenized ≠ more capital onchain ≠ more users trading them. Track all three separately.
Pulled CoinGecko's RWA charts. Tokenized RWA market cap: $9.04B (+6.3% / 24H). Trading volume: $1.64B (+148.2% / 24H).
That's ~18% of total market cap moved in one day.
Volume is accelerating way faster than the value being tokenized. Asset base grows, but activity is spiking harder.
Doesn't mean the whole RWA market is liquid. Could be one asset or issuer driving most of it.
How to read it:
→ Compare market cap by asset type
→ Check if volume follows the same category
→ Switch to issuer view — who controls the activity?
→ Use token count to separate real demand from just adding more listings
→ Move between 24H / 3M / 1Y / Max to see if it's temporary or structural
If token count rises but volume per asset stays weak = supply expansion, not adoption.
If market cap, volume, and issuer activity all grow together across longer timeframes = stronger signal.
Current volume spike is worth investigating. Asset-type and issuer breakdown will show if it's broad RWA growth or concentrated activity in one corner.
More assets tokenized ≠ more capital onchain ≠ more users trading them. Track all three separately.