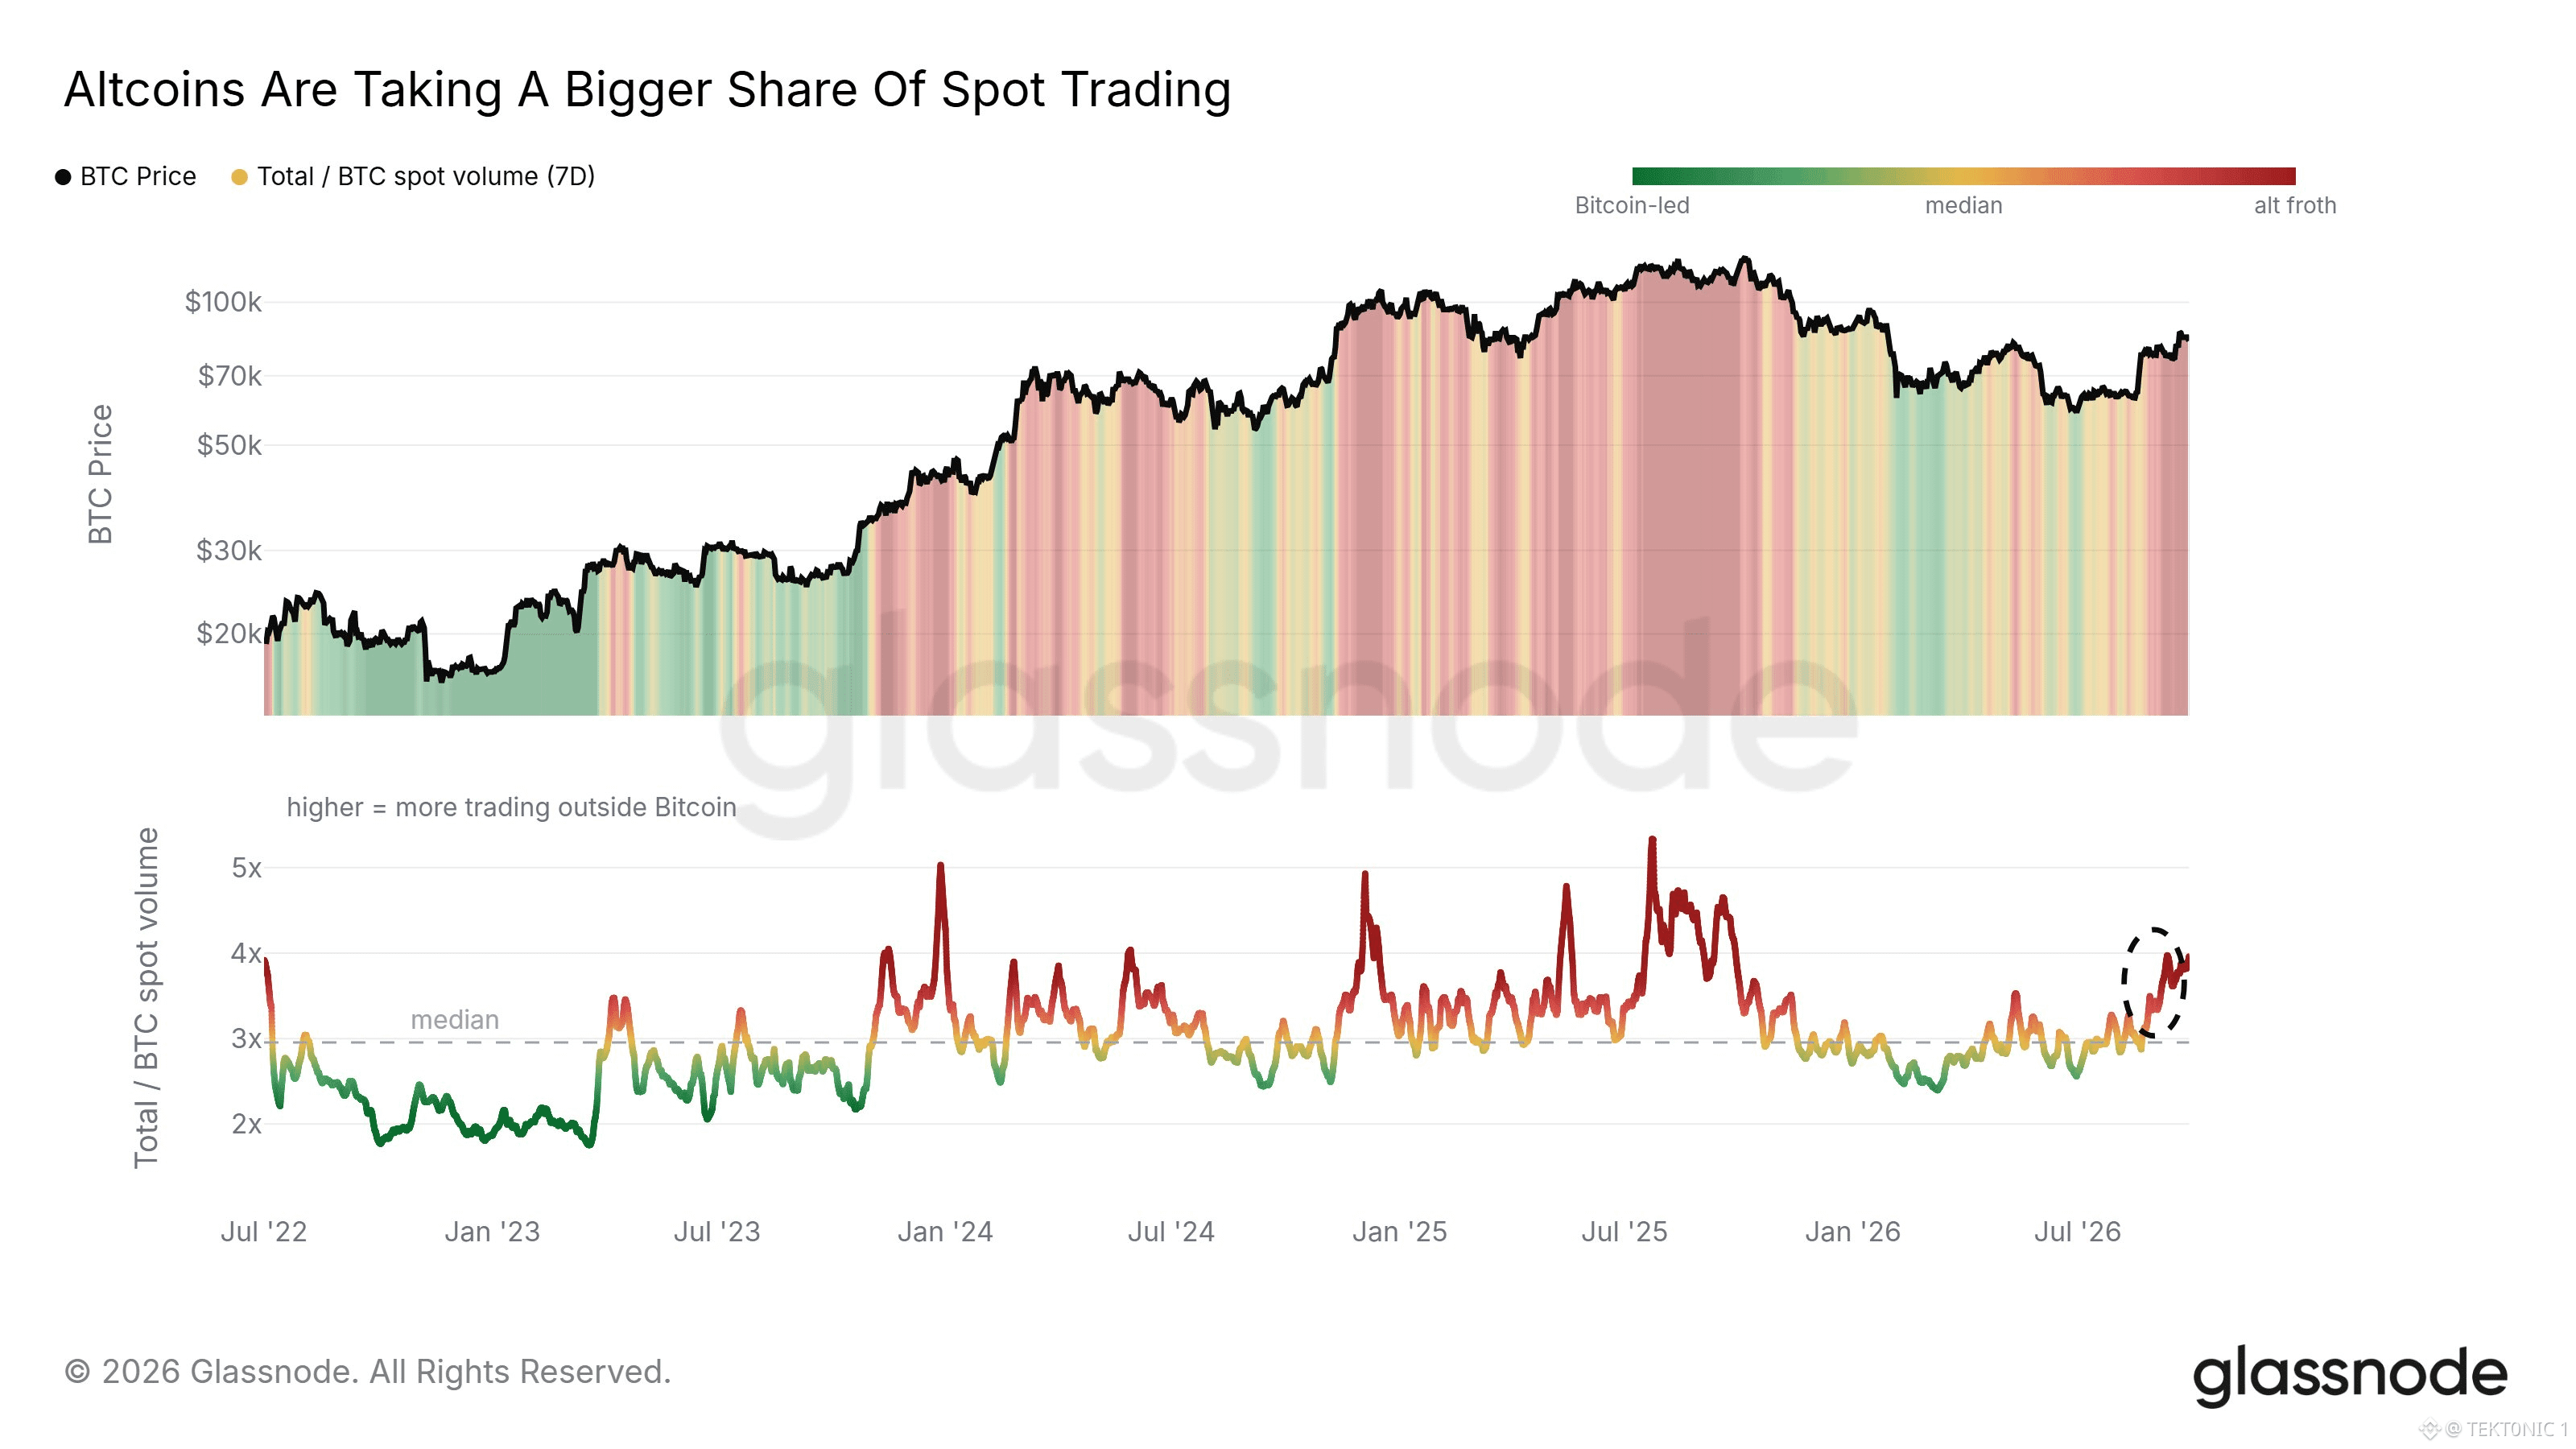
glassnodeによると、スポット取引の総出来高はビットコインの約4倍近くで推移している。これは7日間の比率であり、2025年9月以来の最高水準だ。このチャートにおける中央値はおよそ3倍付近にある。そこを上回るということは、出来高のより多くが $BTC の外側にあることを意味する。この比率は時価総額の優劣(優位性)ではない。どれだけの資金が実際に受け渡しされているかを示す指標だ。上昇は、トレーダーがアルトへローテーションしていることを意味し、ビットコインの価値シェアが崩壊したということではない。ビットコインは依然として時価総額の約58%を占めている。このヒートマップは、そのローテーションが活発になると赤くなる。このパターンはしばしば、局所的なビットコイントップと一致してきた。同じ比率が、2023年後半、2025年初め、そして2025年半ばにかけて5倍近くまで急上昇した。これらのピークがすべてサイクルの終わりを告げたわけではない。ただし、リスクが $BTC そのものよりも速く動いた局面を示してはいた。つまり4倍は高い水準であって、いわゆる吹き上げ(ブローオフ)というよりは上振れだ。ビットコインが $85,000 付近にいる間に、この比率が3倍を上回った状態を維持するか、それとも中央値へと減衰していくかを見てほしい。減衰すれば、値動きは引き続きビットコイン主導だと言える。5倍を明確に超えるなら、熱が再び戻ってきた(投機的な過熱が戻った)ことを示す。この比率は出来高がどこにあるのかを教えてくれるが、トップの時期をそれ自体で当てるものではない。 #BTC Price Analysis# #Bitcoin Price Prediction: What is Bitcoins next move?# $XRP #Altcoin Season#


投稿