


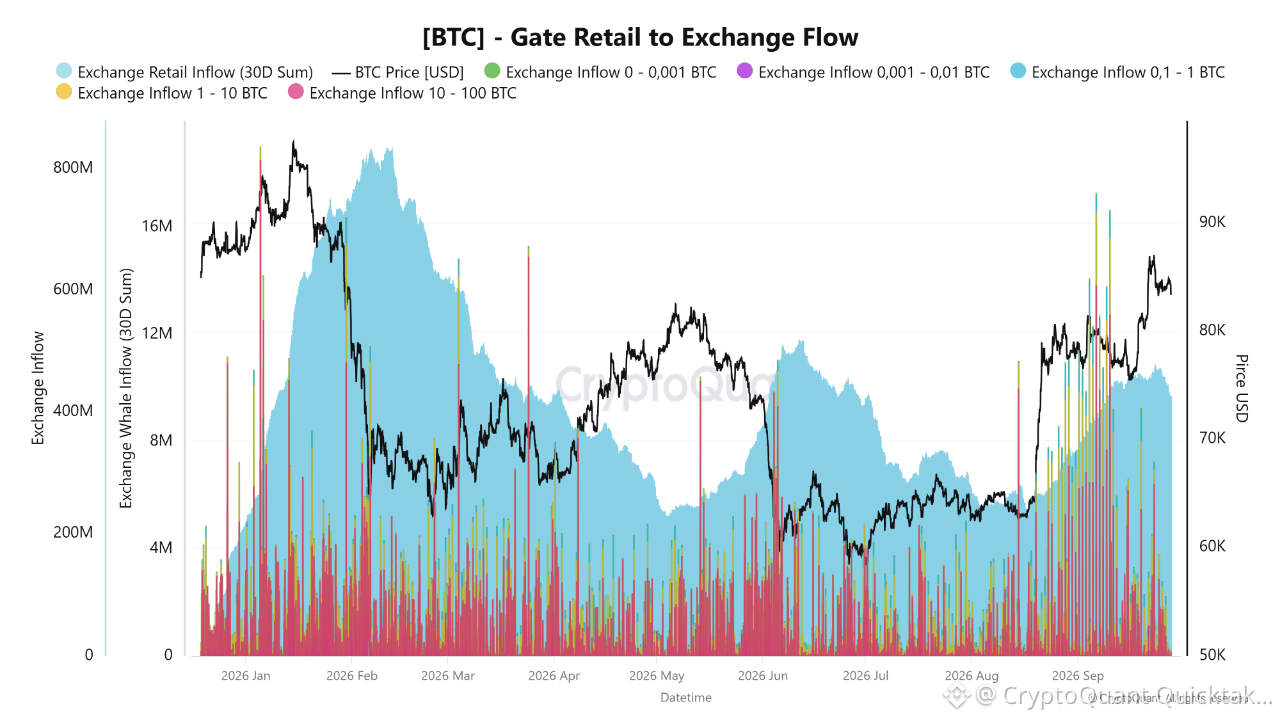
The first thing that stands out on the chart is that the amount of BTC sent to exchanges has increased noticeably, particularly in September, as the price of BTC has been rising. Especially in the current section of the chart, Gate transfers in the 1-10 and 10-100 BTC ranges, which represent large transaction groups, appear much higher and more frequent. From a professional perspective, this structure shows that whales have become more active in the market and that some wallets are moving BTC to exchange liquidity where it can be traded. BTC entering an exchange may indicate preparation for selling, use as collateral, position adjustments for different strategies, or simply liquidity management.
Whale activity increased as BTC rallied from $75K to $87K, suggesting some may have used the rise to realize profits. BTC then peaked near $87.3K before pulling back toward $84K.
Based on the current chart, in my view, the short term risk of profit taking has increased, but there is not yet strong confirmation of whale selling. This is because large transfers also increased as the price moved rapidly from the $75-77K region toward the $85-87K range. This suggests that more BTC liquidity entered the market during the rally and indicates that the $84-87K region could turn into a significant supply zone.
On the other hand, strong inflows into U.S. spot BTC ETFs during the final week of September, along with accelerating exchange outflows across the broader market, indicate that this selling supply is not completely dominant at this stage. Therefore, based on the chart, we can say that whales have become more active.
Holding $84K and reclaiming $86-87K will show whether increased Gate inflows are being absorbed. Whale activity has risen, but there is no clear selling signal yet more likely, whales are adjusting positions and testi
Written by PelinayPA