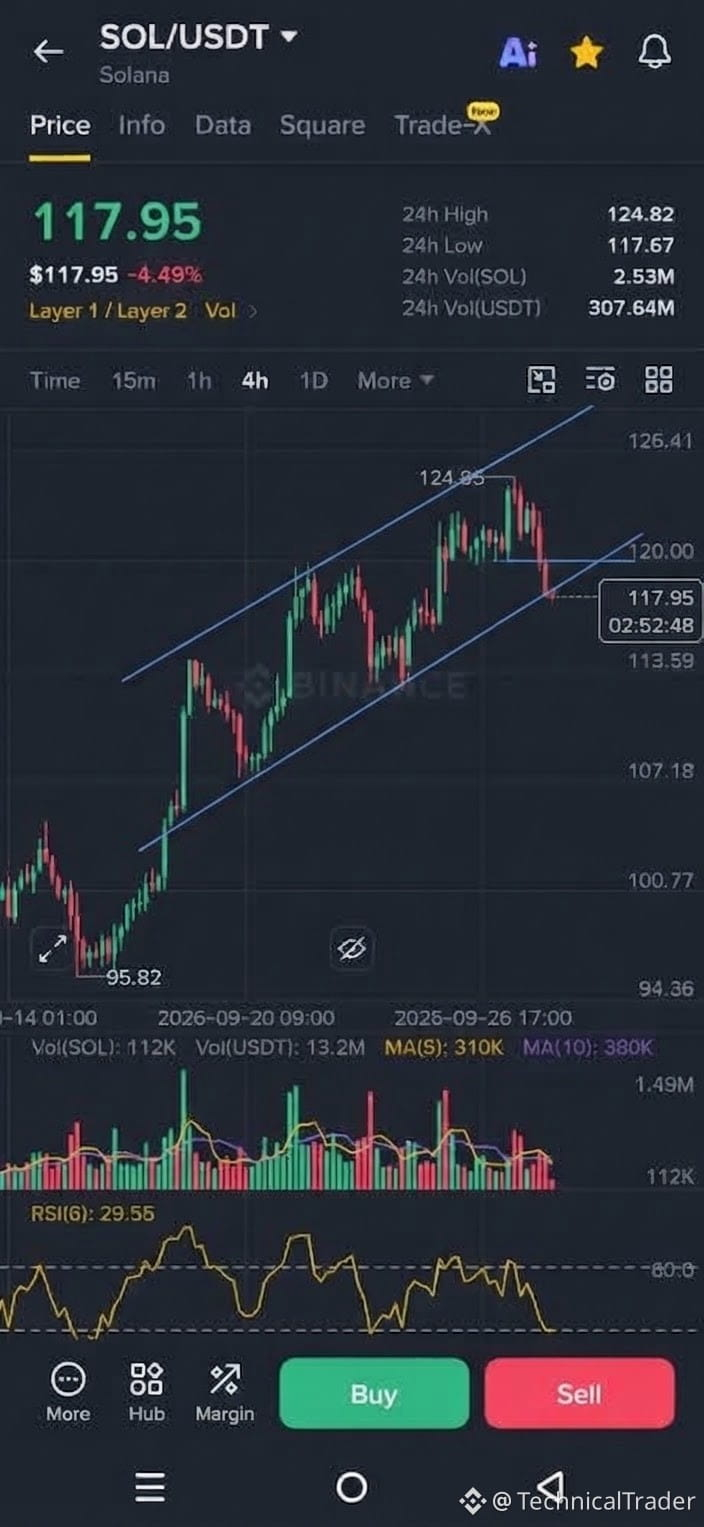
$SOL is currently around 117.95 after getting rejected from the 124.95 area. On the 4H chart, price has been moving inside a rising channel, but now it has pulled back toward the lower trendline support. This is the key area to watch closely.
Now we need to see whether this trendline support holds or breaks. 👀 If price gets support here and reclaims 120, we could see another move toward the 124.82 to 124.95 resistance zone. But if the trendline breaks clearly and price loses 113.59, the current bullish structure would start to weaken. 📉
RSI is around 29.56, showing that downside momentum is stretched, but RSI alone does not confirm a reversal. Look closely at how price reacts around the lower trendline, because that reaction should give us the next important clue. 🎯
For now, keep an eye on 120 and the lower trendline. Holding the trendline and reclaiming 120 would show strength, while a clear breakdown below the trendline and 113.59 would invalidate the current bullish channel structure. 👀🔥
Guys follow for more chart analysis 😎 I’ll keep showing you exactly what the chart is telling us. 👀🔥
Now we need to see whether this trendline support holds or breaks. 👀 If price gets support here and reclaims 120, we could see another move toward the 124.82 to 124.95 resistance zone. But if the trendline breaks clearly and price loses 113.59, the current bullish structure would start to weaken. 📉
RSI is around 29.56, showing that downside momentum is stretched, but RSI alone does not confirm a reversal. Look closely at how price reacts around the lower trendline, because that reaction should give us the next important clue. 🎯
For now, keep an eye on 120 and the lower trendline. Holding the trendline and reclaiming 120 would show strength, while a clear breakdown below the trendline and 113.59 would invalidate the current bullish channel structure. 👀🔥
Guys follow for more chart analysis 😎 I’ll keep showing you exactly what the chart is telling us. 👀🔥