$MARSCOIN bouncing hard off the lows… but can it keep this momentum?
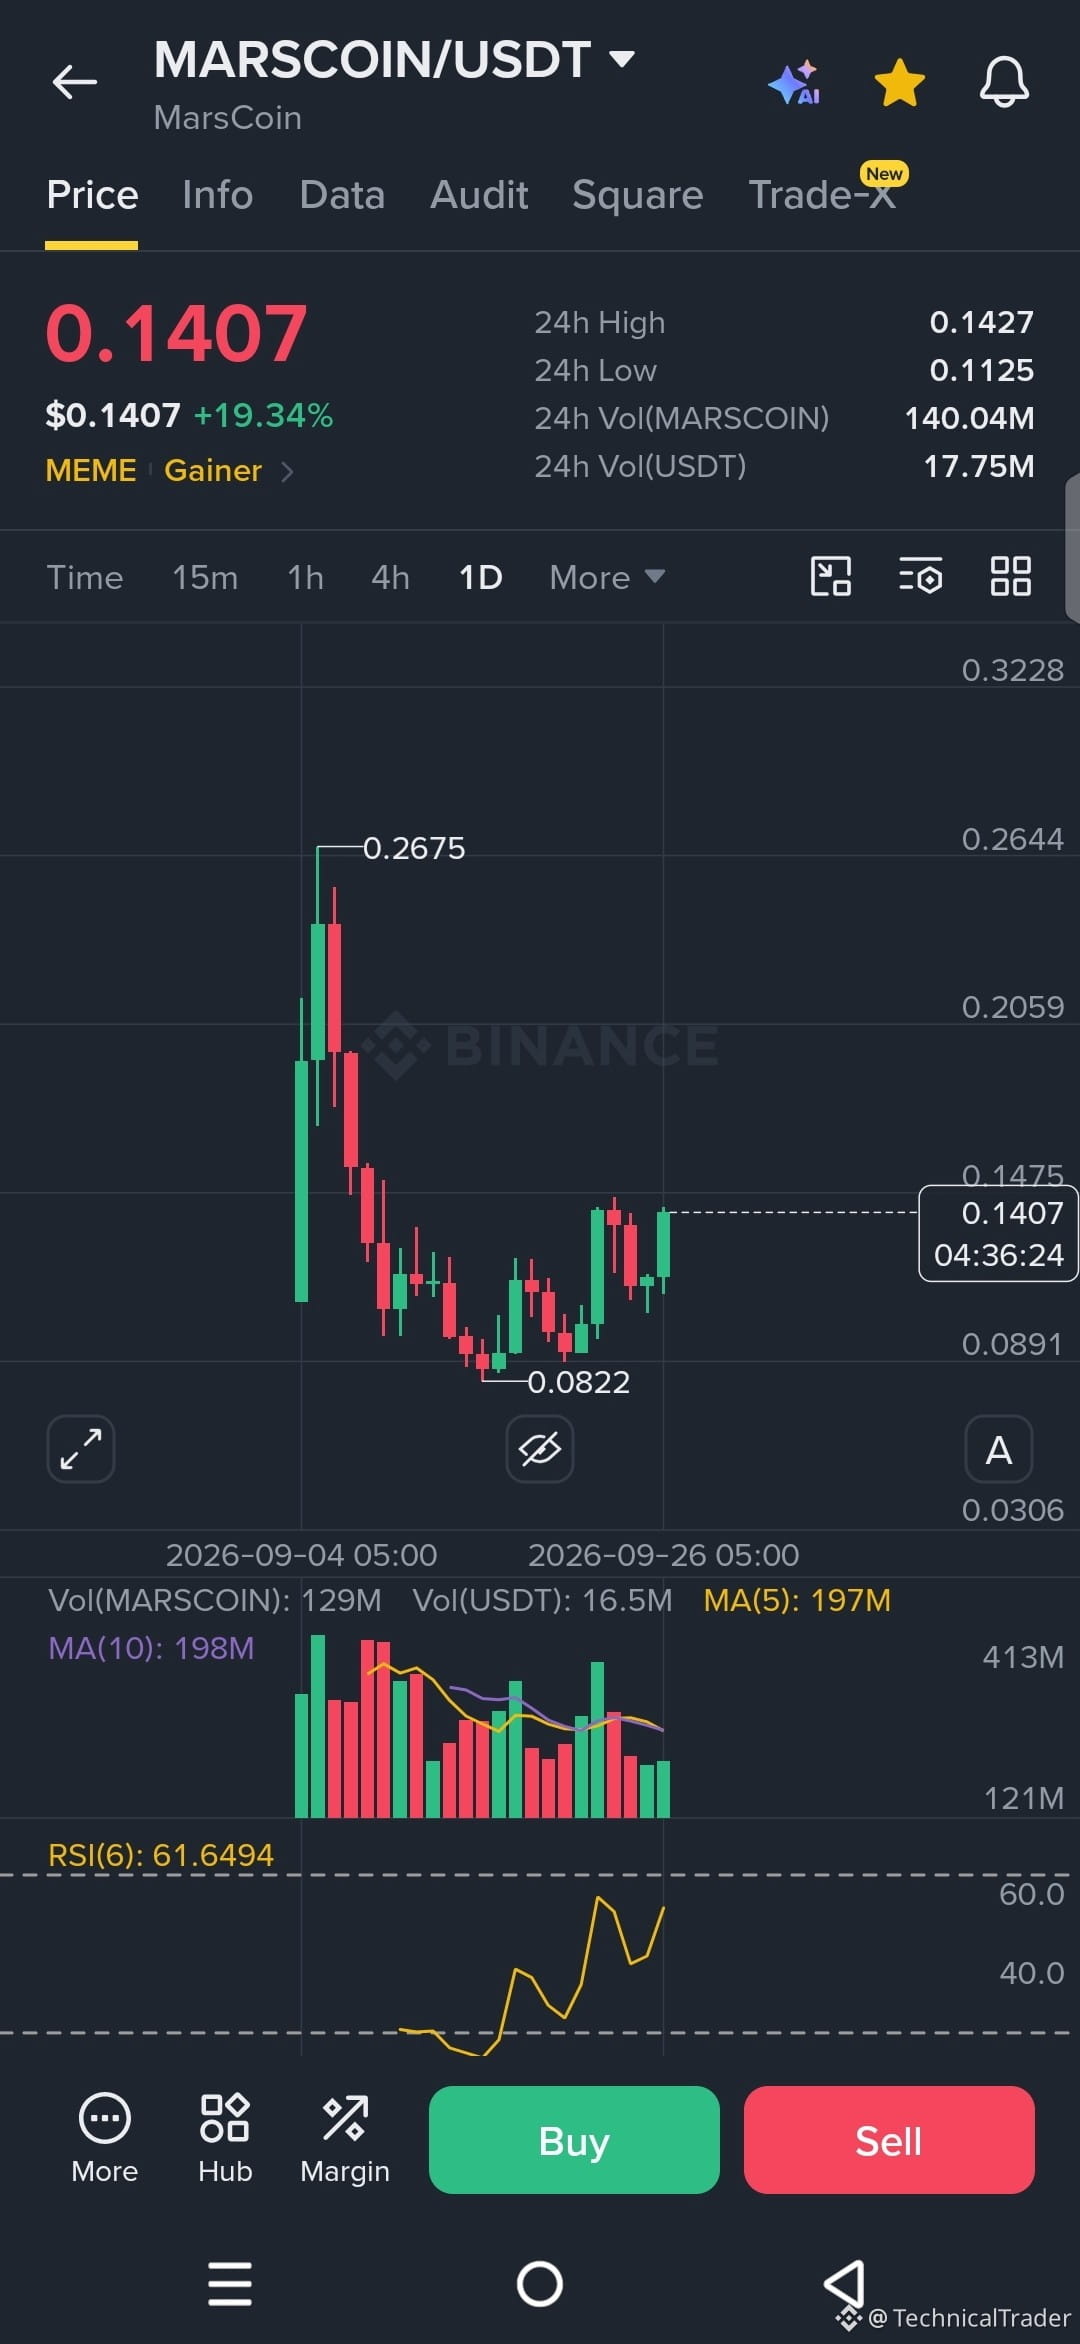
Look at this $MARSCOIN chart on the daily. Price is sitting at 0.1407 right now after a solid +19% day, and the recovery from that deep low is getting interesting 👀
We had that massive green candle spiking all the way up to 0.2675 early on, then a heavy sell-off that dragged it straight down to 0.0822. From there price started grinding higher with some choppy candles, and now we’re seeing a clearer push back up with consecutive green closes.
Market structure flipped from that sharp dump into a recovery phase. We’re no longer making lower lows, and the recent candles are holding higher.
Key level I’m watching is that 0.0822 low. Price rejected hard there and has been climbing since. On the upside, the old spike high at 0.2675 is still way up there, but nearer term the area around 0.1475 looks like it’s acting as a short-term ceiling.
Volume has been decent on the way up, and RSI(6) is sitting at 61.6 — not overbought yet, which leaves room if buyers stay in control.
If bulls keep pushing, a clean break and hold above the recent highs near 0.1475 could open the door toward higher levels. If sellers step in and we lose the current structure, a move back toward that 0.0822 zone becomes the main risk.
This is the part I’m watching closely — how price reacts around these recent highs. A strong close above them keeps the recovery alive. A rejection and drop back below the last swing low would change the picture fast.
Guys follow for more chart analysis 😎 I’ll keep showing you exactly what the chart is telling us. 👀🔥
Look at this $MARSCOIN chart on the daily. Price is sitting at 0.1407 right now after a solid +19% day, and the recovery from that deep low is getting interesting 👀
We had that massive green candle spiking all the way up to 0.2675 early on, then a heavy sell-off that dragged it straight down to 0.0822. From there price started grinding higher with some choppy candles, and now we’re seeing a clearer push back up with consecutive green closes.
Market structure flipped from that sharp dump into a recovery phase. We’re no longer making lower lows, and the recent candles are holding higher.
Key level I’m watching is that 0.0822 low. Price rejected hard there and has been climbing since. On the upside, the old spike high at 0.2675 is still way up there, but nearer term the area around 0.1475 looks like it’s acting as a short-term ceiling.
Volume has been decent on the way up, and RSI(6) is sitting at 61.6 — not overbought yet, which leaves room if buyers stay in control.
If bulls keep pushing, a clean break and hold above the recent highs near 0.1475 could open the door toward higher levels. If sellers step in and we lose the current structure, a move back toward that 0.0822 zone becomes the main risk.
This is the part I’m watching closely — how price reacts around these recent highs. A strong close above them keeps the recovery alive. A rejection and drop back below the last swing low would change the picture fast.
Guys follow for more chart analysis 😎 I’ll keep showing you exactly what the chart is telling us. 👀🔥