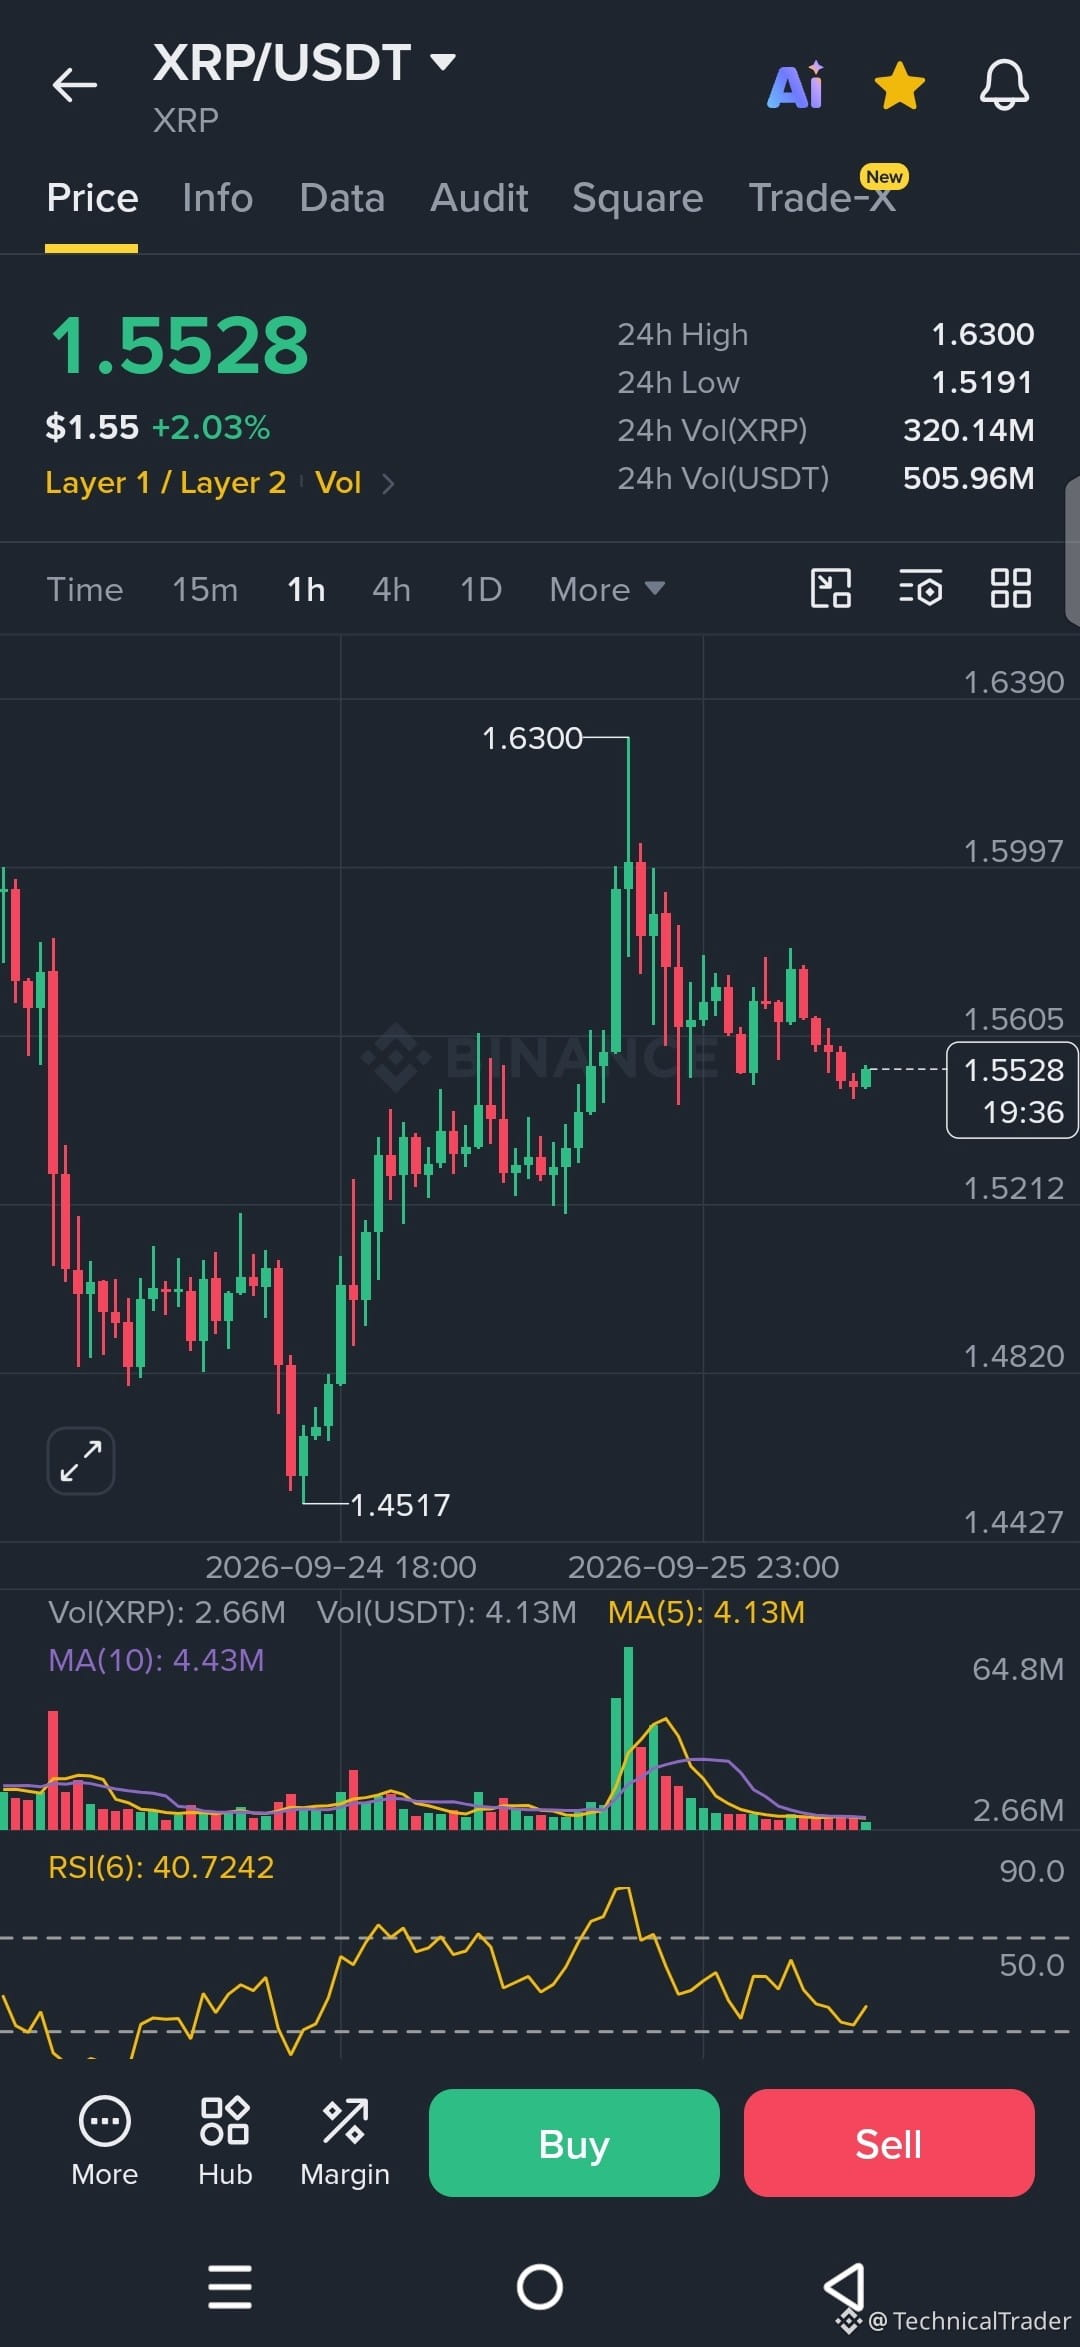
Guys, $XRP pushed all the way to 1.6300 and got sharply rejected. Since then, price has been cooling off and is now sitting around 1.5528, making this area interesting to watch.
The 1H structure still shows the earlier bullish move from 1.4517, but after the 1.6300 rejection, price has started making weaker swings and drifting lower. The big question now is whether buyers can defend the 1.5212 support area.
Look at 1.5212 closely 👀. Price has previously reacted around this zone, so holding above it could give buyers a chance to push back toward 1.5605 and then 1.5997. A move above 1.5997 would bring the 1.6300 high back into focus 🔥.
On the other side, if XRP loses 1.5212 with strong selling, the next visible area below is around 1.4820. That would also weaken the recent bullish structure and show that sellers are gaining more control 📉.
The RSI is around 40.7, so momentum has cooled significantly from the earlier spike. Volume has also declined after the large volume expansion during the move toward 1.6300. For me, that makes the reaction at support more important than simply chasing the previous pump.
The levels are pretty clear here: 1.5212 is the key support, while 1.5997 to 1.6300 is the major resistance zone. Watch how price behaves around these areas rather than assuming either direction is guaranteed.
The next thing I’m watching is whether XRP can reclaim 1.5605 and build strength toward 1.5997, or whether 1.5212 breaks. A sustained move below 1.5212 would invalidate the current bullish structure I’m watching. 👀
Guys, follow for more chart analysis 😎 I’ll keep showing you exactly what the chart is telling us. 👀🔥
The 1H structure still shows the earlier bullish move from 1.4517, but after the 1.6300 rejection, price has started making weaker swings and drifting lower. The big question now is whether buyers can defend the 1.5212 support area.
Look at 1.5212 closely 👀. Price has previously reacted around this zone, so holding above it could give buyers a chance to push back toward 1.5605 and then 1.5997. A move above 1.5997 would bring the 1.6300 high back into focus 🔥.
On the other side, if XRP loses 1.5212 with strong selling, the next visible area below is around 1.4820. That would also weaken the recent bullish structure and show that sellers are gaining more control 📉.
The RSI is around 40.7, so momentum has cooled significantly from the earlier spike. Volume has also declined after the large volume expansion during the move toward 1.6300. For me, that makes the reaction at support more important than simply chasing the previous pump.
The levels are pretty clear here: 1.5212 is the key support, while 1.5997 to 1.6300 is the major resistance zone. Watch how price behaves around these areas rather than assuming either direction is guaranteed.
The next thing I’m watching is whether XRP can reclaim 1.5605 and build strength toward 1.5997, or whether 1.5212 breaks. A sustained move below 1.5212 would invalidate the current bullish structure I’m watching. 👀
Guys, follow for more chart analysis 😎 I’ll keep showing you exactly what the chart is telling us. 👀🔥