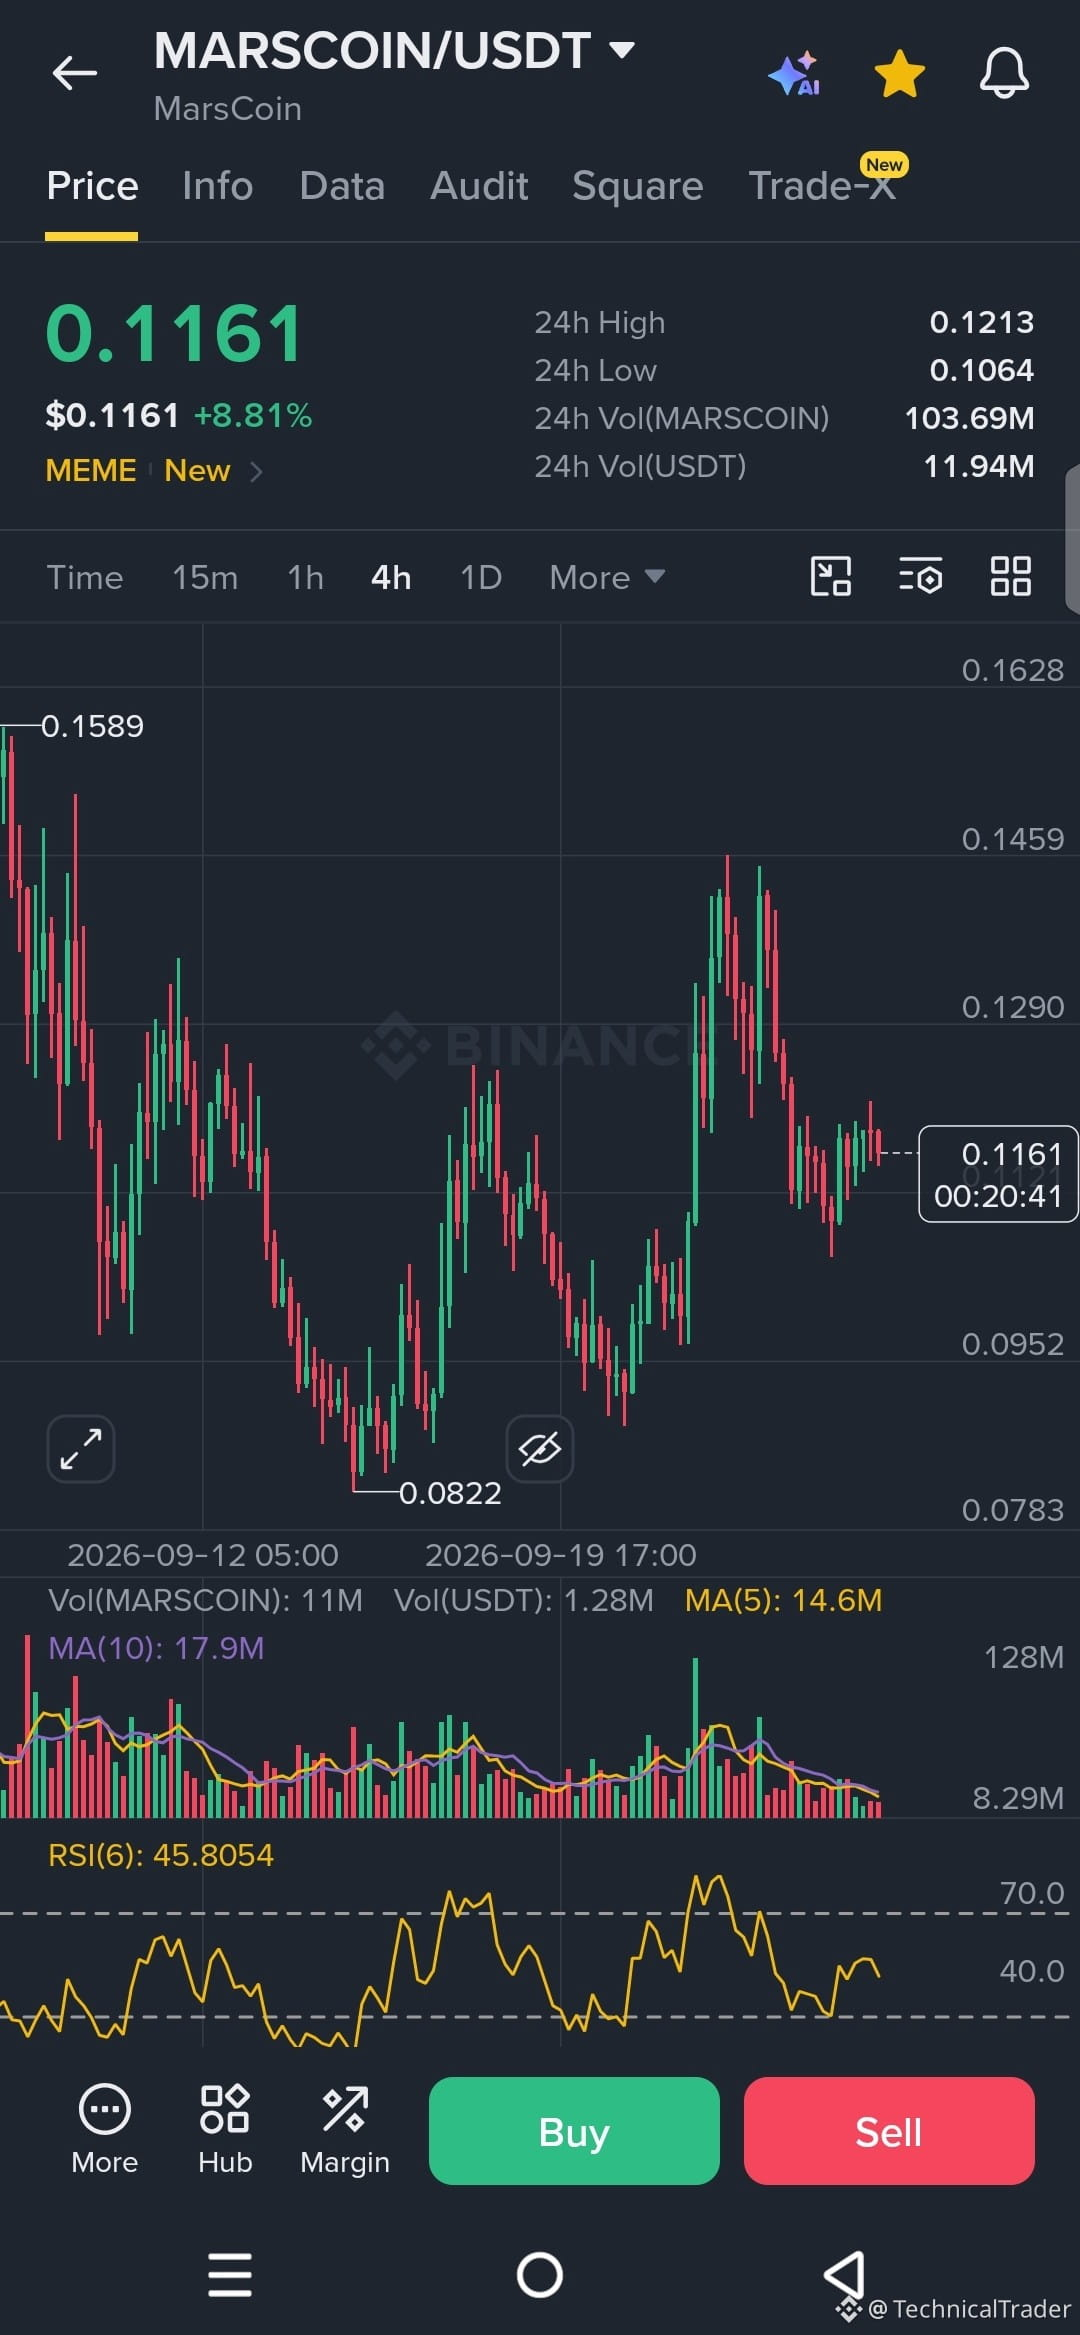
Guys, look at $MARSCOIN here, after pushing up toward the 0.1459–0.1589 area, price got rejected and pulled back hard. Now it’s sitting around 0.1161, trying to stabilize.
On the 4H chart, the recent structure shows a strong move up from around 0.0952, followed by rejection near 0.1459. Since then, price has been making lower highs and is now moving sideways around 0.1161.
The first level I’m watching is 0.1290. A clean move above this area would show buyers are starting to regain control, with the previous reaction zone around 0.1459 becoming the next important resistance. 🔥
On the other side, 0.1064–0.0952 is the important support area visible on the chart. If price loses this zone, the recent bullish move would be significantly weakened and the chart could start looking bearish again 📉.
Volume has also cooled down compared with the large spike during the earlier move, so the next expansion in volume could be important. RSI is around 45.8, sitting near the middle rather than showing an extreme condition.
So right now, I’m watching how $MARSCoin reacts between 0.1064–0.1161 support and 0.1290 resistance. A break above 0.1290 would strengthen the bullish scenario toward 0.1459, while a breakdown below 0.1064 would put 0.0952 back in focus.
The current analysis would be weakened if price decisively breaks below 0.0952. 👀
Guys, follow for more chart analysis 😎 I’ll keep showing you exactly what the chart is telling us. 👀🔥
On the 4H chart, the recent structure shows a strong move up from around 0.0952, followed by rejection near 0.1459. Since then, price has been making lower highs and is now moving sideways around 0.1161.
The first level I’m watching is 0.1290. A clean move above this area would show buyers are starting to regain control, with the previous reaction zone around 0.1459 becoming the next important resistance. 🔥
On the other side, 0.1064–0.0952 is the important support area visible on the chart. If price loses this zone, the recent bullish move would be significantly weakened and the chart could start looking bearish again 📉.
Volume has also cooled down compared with the large spike during the earlier move, so the next expansion in volume could be important. RSI is around 45.8, sitting near the middle rather than showing an extreme condition.
So right now, I’m watching how $MARSCoin reacts between 0.1064–0.1161 support and 0.1290 resistance. A break above 0.1290 would strengthen the bullish scenario toward 0.1459, while a breakdown below 0.1064 would put 0.0952 back in focus.
The current analysis would be weakened if price decisively breaks below 0.0952. 👀
Guys, follow for more chart analysis 😎 I’ll keep showing you exactly what the chart is telling us. 👀🔥