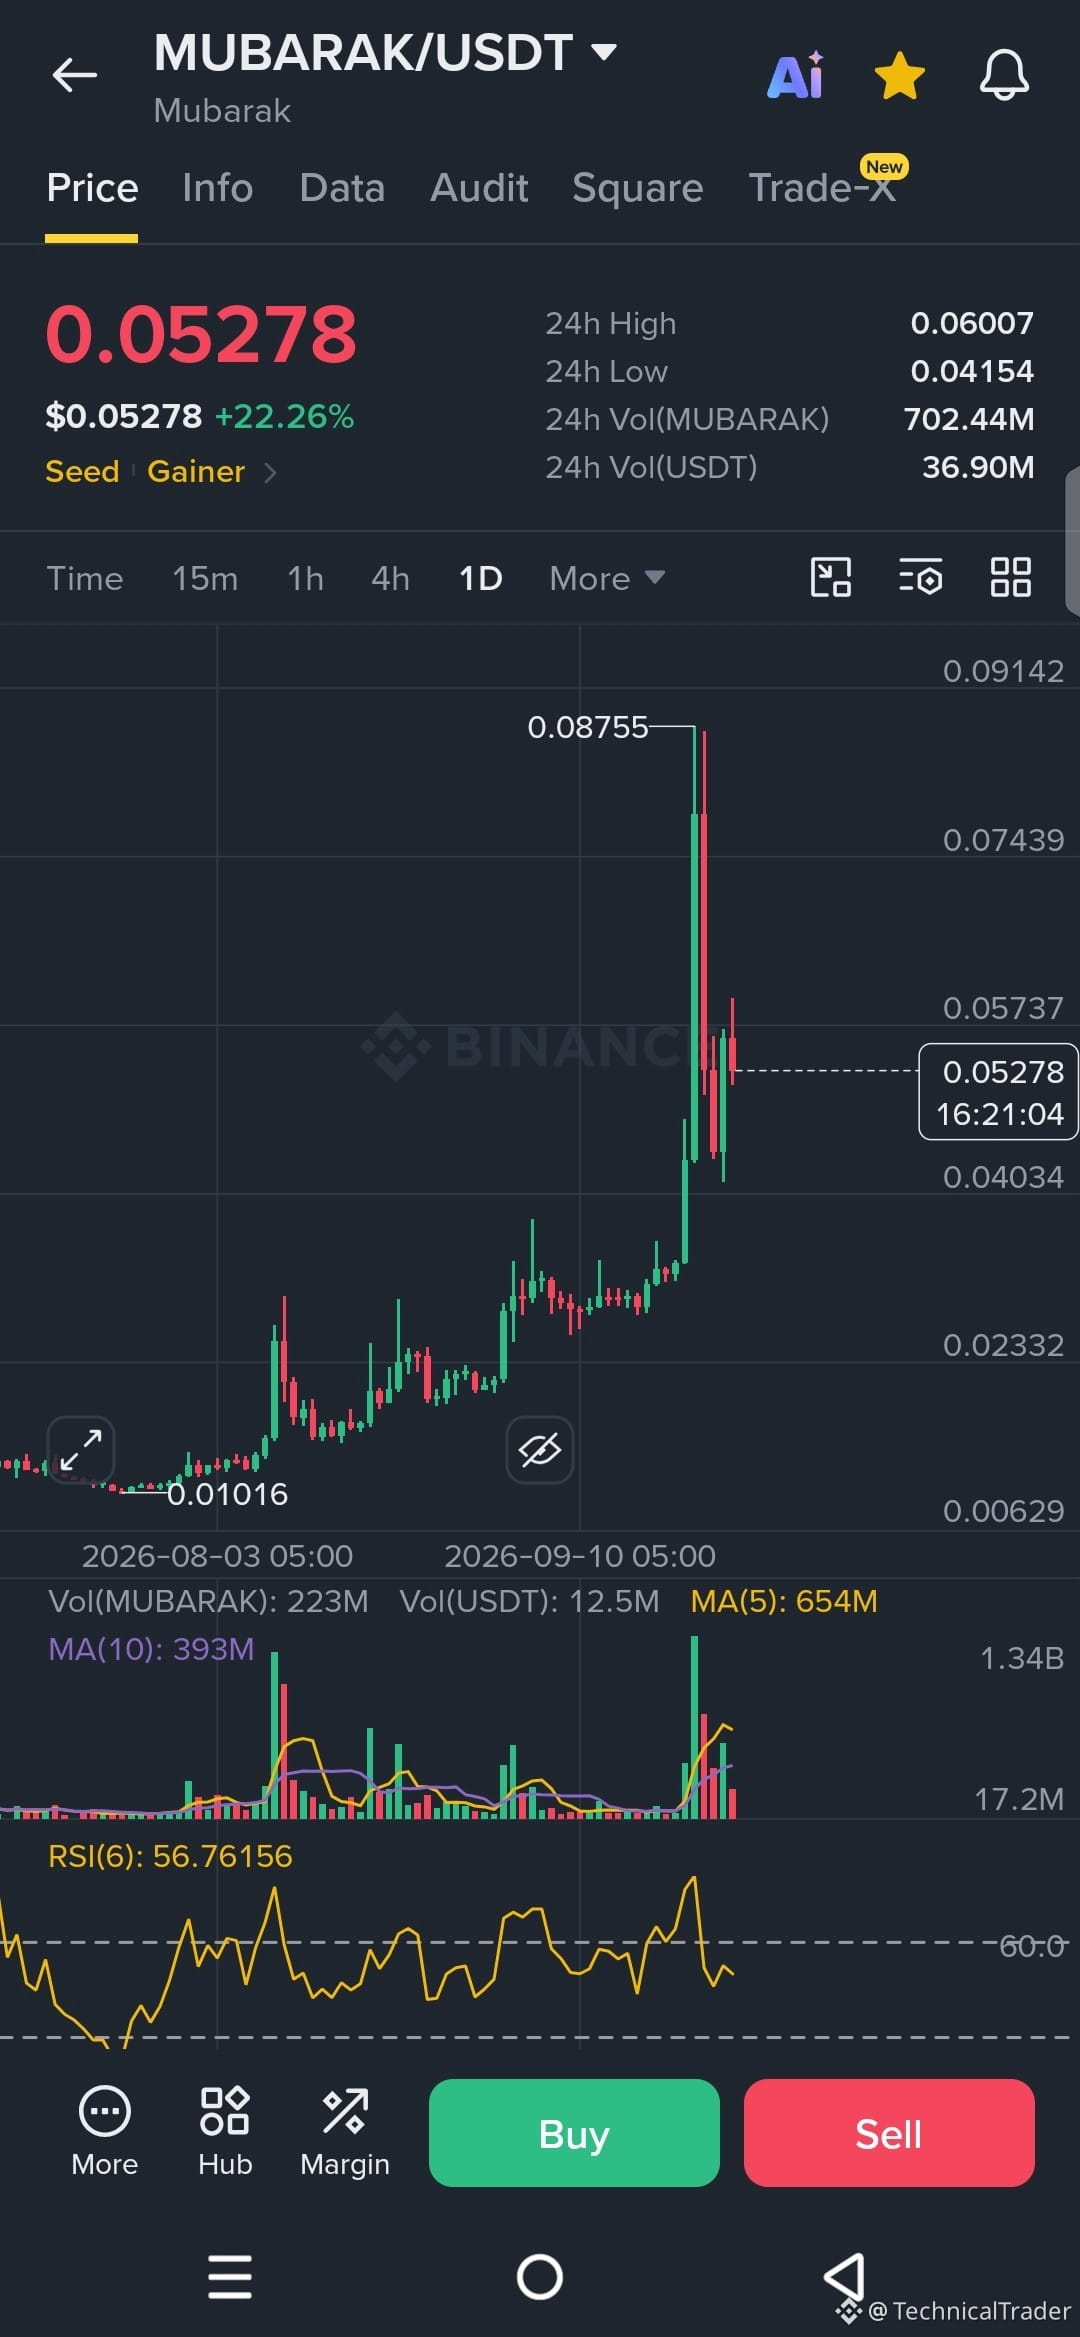
Guys, $MUBARAK has already made a huge move, but now the interesting part is what happens after that sharp rejection from 0.08755. Price pushed aggressively higher, got rejected, and is currently trading around 0.05278.
The bigger structure is still showing a strong upward move, with price climbing from around 0.01 and forming higher highs and higher lows. But that huge rejection from 0.08755 shows that sellers stepped in heavily at the top.
Here’s what I’m watching closely 👀 0.05737 is the first important resistance area. Price recently reacted around this zone, so a clean move above it could bring another attempt toward 0.07439 and potentially the previous high at 0.08755.
On the other side, 0.04034 is the key support visible on the chart. If price holds above it, the recent recovery can remain intact. But if 0.04034 breaks decisively, the next visible area I’d watch is around 0.02332 📉.
Volume is also very noticeable during the recent expansion, showing that the big move attracted heavy activity. RSI is now around 56.76, so unlike the extreme reading at the top, momentum has cooled considerably.
So the levels are pretty clear: 0.05737 on the upside and 0.04034 on the downside. A strong break and hold above 0.05737 would make the higher levels relevant again, while losing 0.04034 would weaken the current structure.
The main thing I’m watching next is how $MUBARAK reacts around 0.05737 and whether buyers can reclaim it. A breakdown below 0.04034 would invalidate the current bullish structure I’m tracking. ⚡️
Guys, follow for more chart analysis 😎 I’ll keep showing you exactly what the chart is telling us. 👀🔥
The bigger structure is still showing a strong upward move, with price climbing from around 0.01 and forming higher highs and higher lows. But that huge rejection from 0.08755 shows that sellers stepped in heavily at the top.
Here’s what I’m watching closely 👀 0.05737 is the first important resistance area. Price recently reacted around this zone, so a clean move above it could bring another attempt toward 0.07439 and potentially the previous high at 0.08755.
On the other side, 0.04034 is the key support visible on the chart. If price holds above it, the recent recovery can remain intact. But if 0.04034 breaks decisively, the next visible area I’d watch is around 0.02332 📉.
Volume is also very noticeable during the recent expansion, showing that the big move attracted heavy activity. RSI is now around 56.76, so unlike the extreme reading at the top, momentum has cooled considerably.
So the levels are pretty clear: 0.05737 on the upside and 0.04034 on the downside. A strong break and hold above 0.05737 would make the higher levels relevant again, while losing 0.04034 would weaken the current structure.
The main thing I’m watching next is how $MUBARAK reacts around 0.05737 and whether buyers can reclaim it. A breakdown below 0.04034 would invalidate the current bullish structure I’m tracking. ⚡️
Guys, follow for more chart analysis 😎 I’ll keep showing you exactly what the chart is telling us. 👀🔥