#cryptotradingpro #BTC
🔥 $BTC /USDT: Cluster Analysis and Liquidity Map
After an impulsive move to a high near $87,385, Bitcoin has entered a phase of natural consolidation. The price is currently pinned near the volume midpoint in the $83,800–$84,000 range.
What do metrics show across different timeframes? 📊
📉 Delta and Volume (CVD):
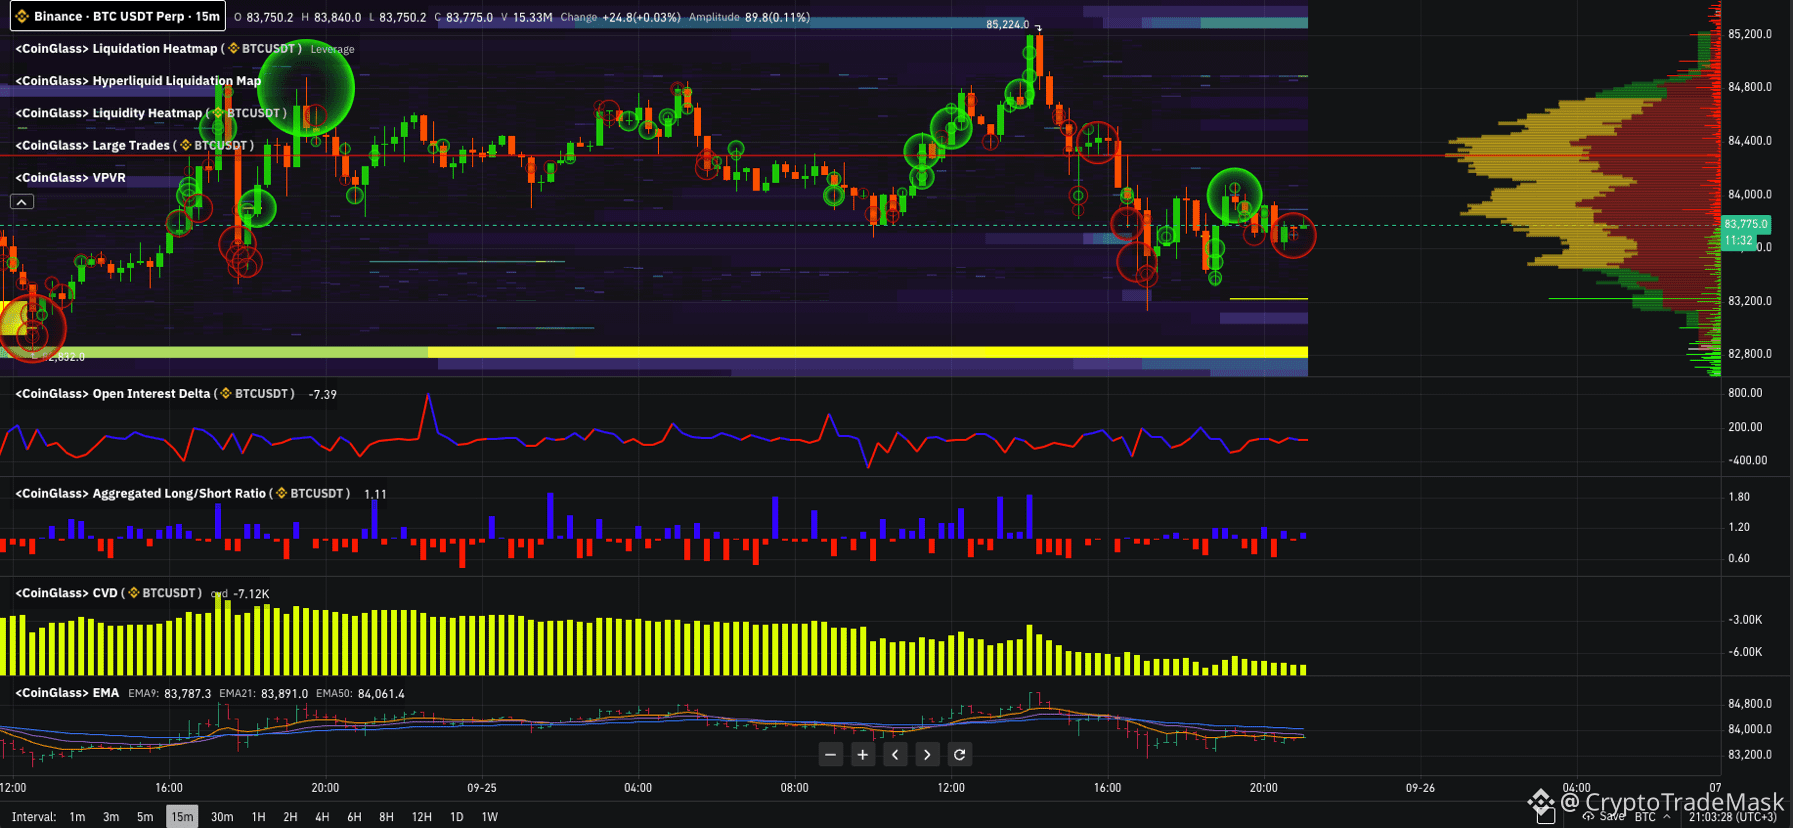
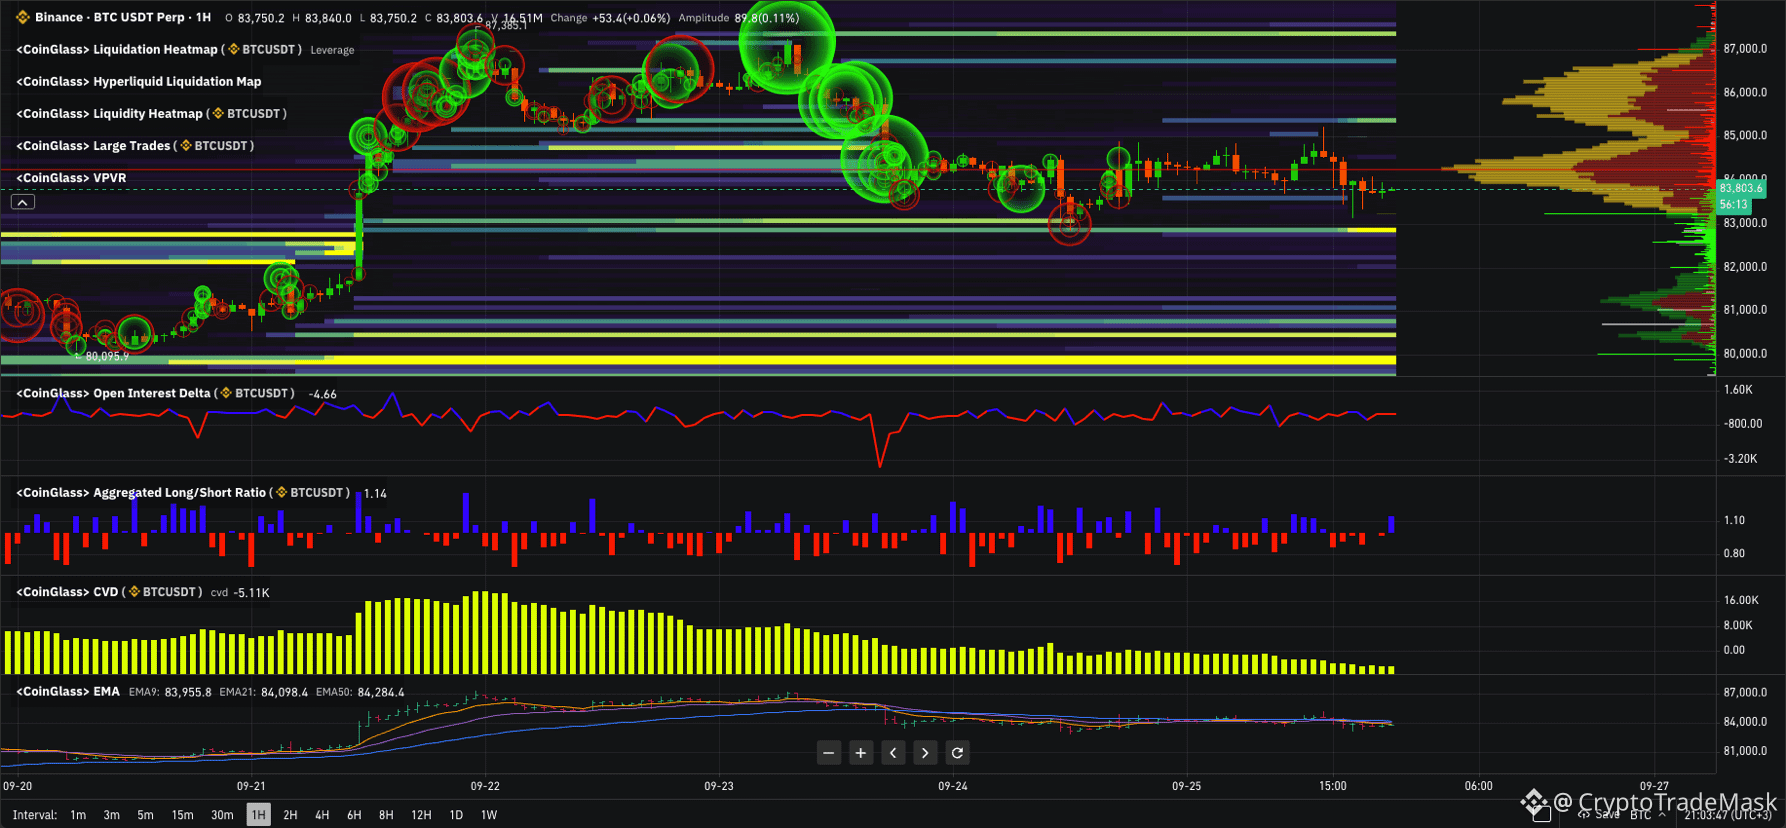
On the 15m and 1H charts, a downward shift in CVD is visible—market sellers continue to exert local downward pressure on the price, yet Open Interest (OI) is gradually declining. This indicates deleveraging rather than the mass opening of aggressive short positions.
🎯 Liquidity Map (Heatmap):
Support zones: A major buyer cluster and a pool of long liquidations are concentrated in the narrow $82,800–$83,000 corridor.
Resistance zones: The primary magnet for a short squeeze lies at the $85,200 level and further up in the $86,500–$87,400 range.
🧠 Potential Scenarios:
1️⃣ Liquidity Sweep and Rebound (Primary Scenario)
The most logical mechanism for the trend to continue involves a local dip into the $82,800–$83,000 zone to trigger long-position stop-losses. A price recovery above $83,500 would clear the path for a test of the $85,200+ level.
2️⃣ Upside breakout from consolidation
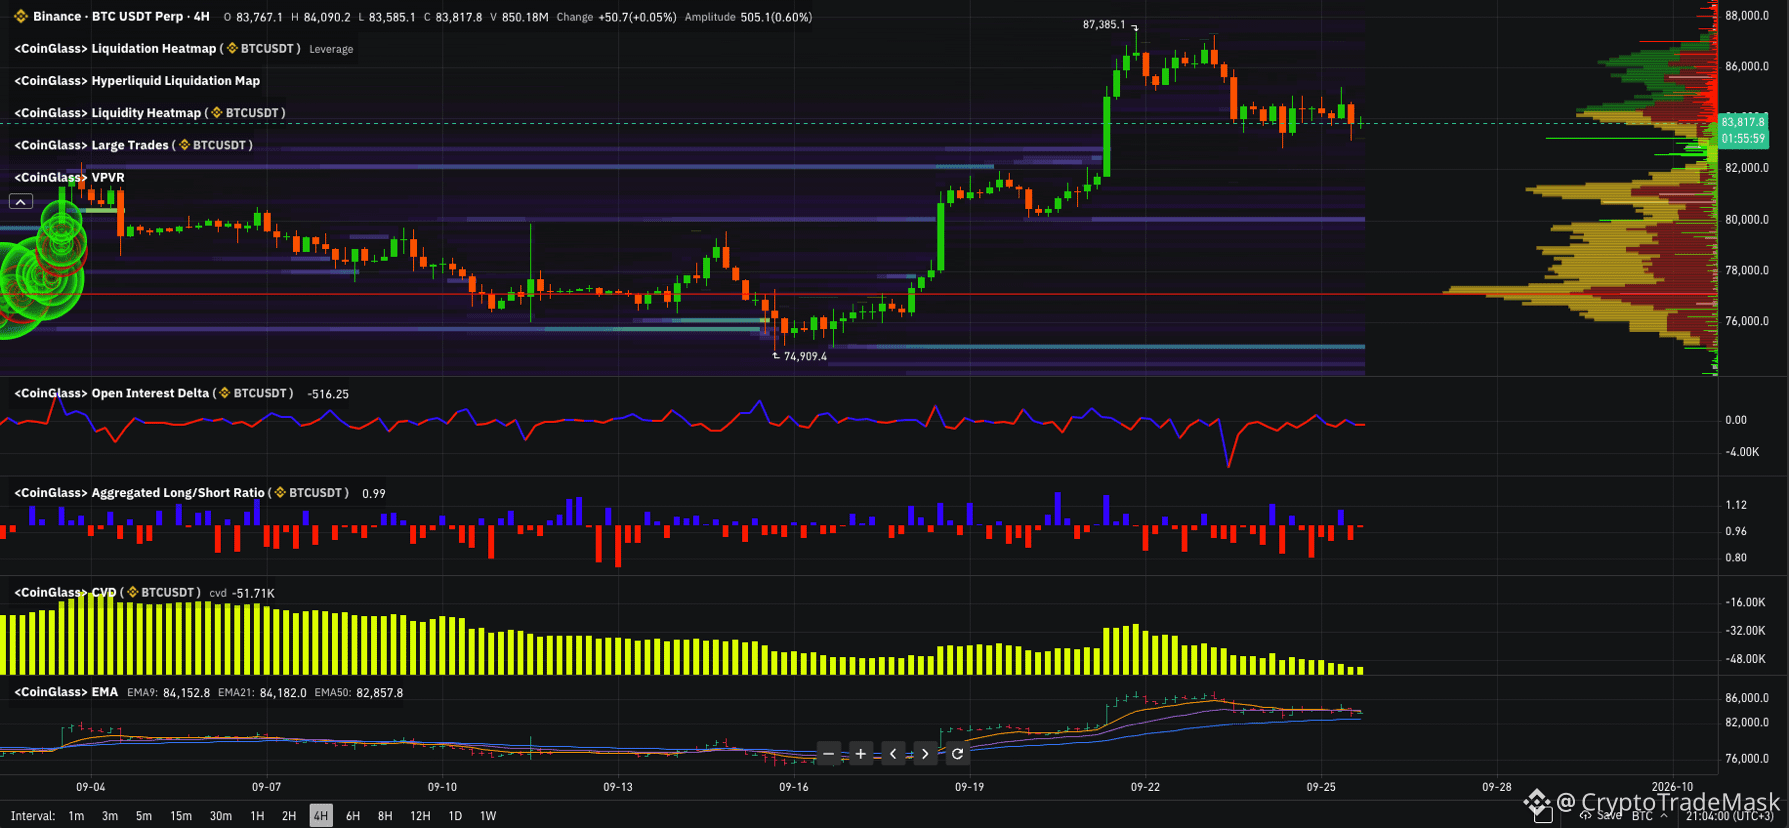
Establishing support above $84,500 on the 1H/4H charts will confirm the end of the local pullback and trigger a move to retest $87,385.
3️⃣ Deeper correction
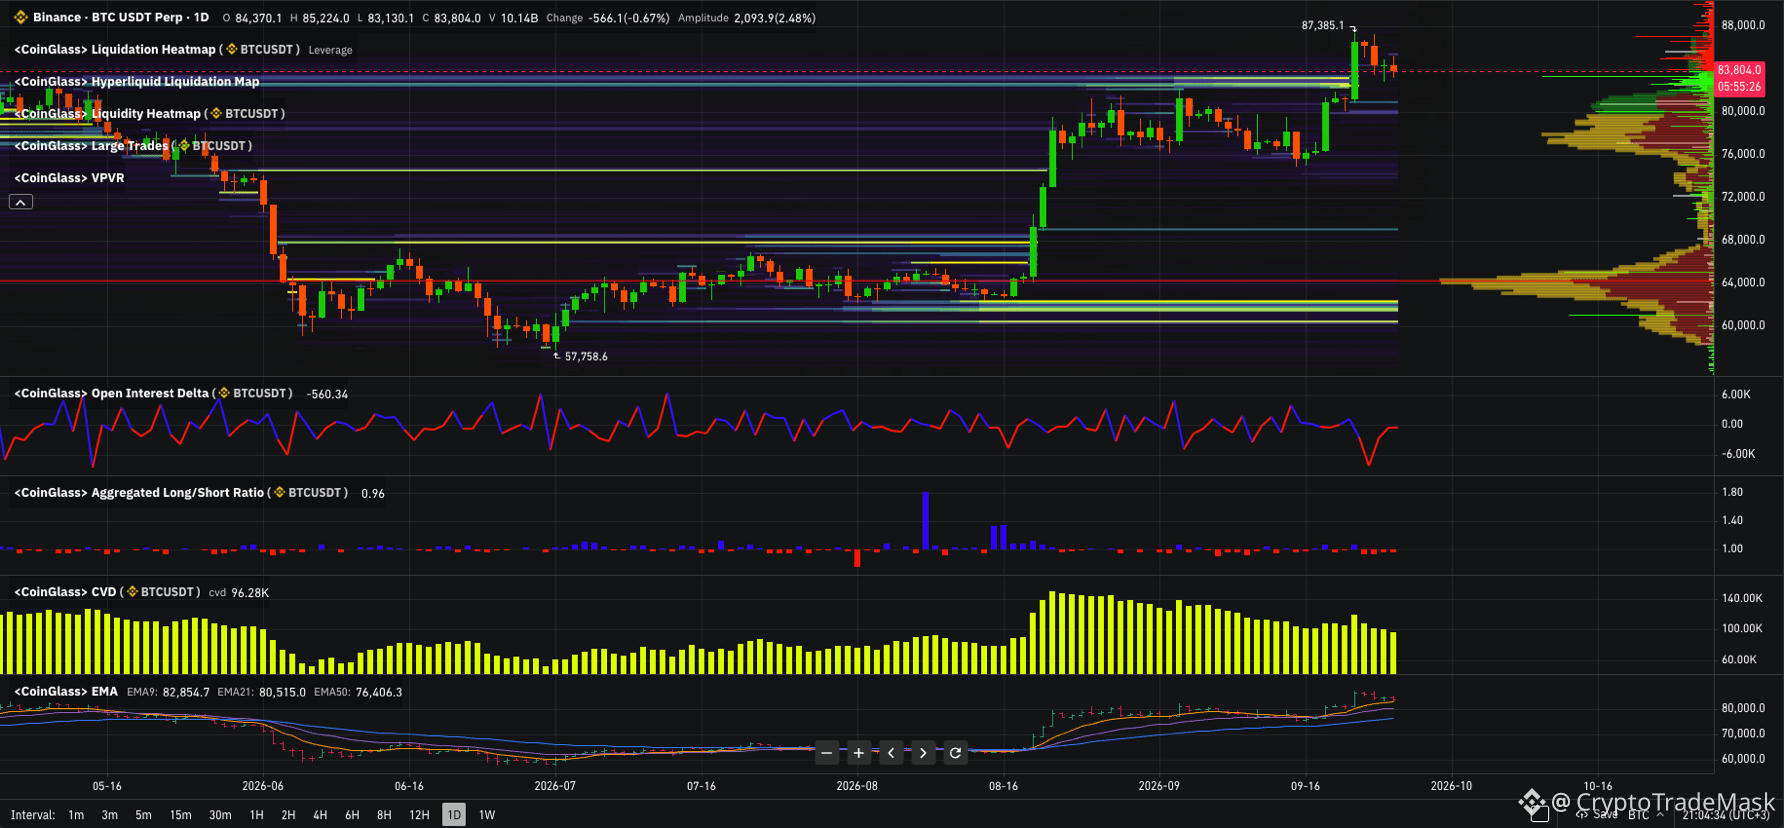
Losing the $82,500 support level risks a drop to the daily 21-EMA, in the $80,500–$81,000 range.
⚠️ Recommendation: Avoid rushing into the market while the price is in the middle of the sideways range ($83,800). Wait for the price reaction at key liquidity levels!
🔥 $BTC /USDT: Cluster Analysis and Liquidity Map
After an impulsive move to a high near $87,385, Bitcoin has entered a phase of natural consolidation. The price is currently pinned near the volume midpoint in the $83,800–$84,000 range.
What do metrics show across different timeframes? 📊
📉 Delta and Volume (CVD):
On the 15m and 1H charts, a downward shift in CVD is visible—market sellers continue to exert local downward pressure on the price, yet Open Interest (OI) is gradually declining. This indicates deleveraging rather than the mass opening of aggressive short positions.
🎯 Liquidity Map (Heatmap):
Support zones: A major buyer cluster and a pool of long liquidations are concentrated in the narrow $82,800–$83,000 corridor.
Resistance zones: The primary magnet for a short squeeze lies at the $85,200 level and further up in the $86,500–$87,400 range.
🧠 Potential Scenarios:
1️⃣ Liquidity Sweep and Rebound (Primary Scenario)
The most logical mechanism for the trend to continue involves a local dip into the $82,800–$83,000 zone to trigger long-position stop-losses. A price recovery above $83,500 would clear the path for a test of the $85,200+ level.
2️⃣ Upside breakout from consolidation
Establishing support above $84,500 on the 1H/4H charts will confirm the end of the local pullback and trigger a move to retest $87,385.
3️⃣ Deeper correction
Losing the $82,500 support level risks a drop to the daily 21-EMA, in the $80,500–$81,000 range.
⚠️ Recommendation: Avoid rushing into the market while the price is in the middle of the sideways range ($83,800). Wait for the price reaction at key liquidity levels!