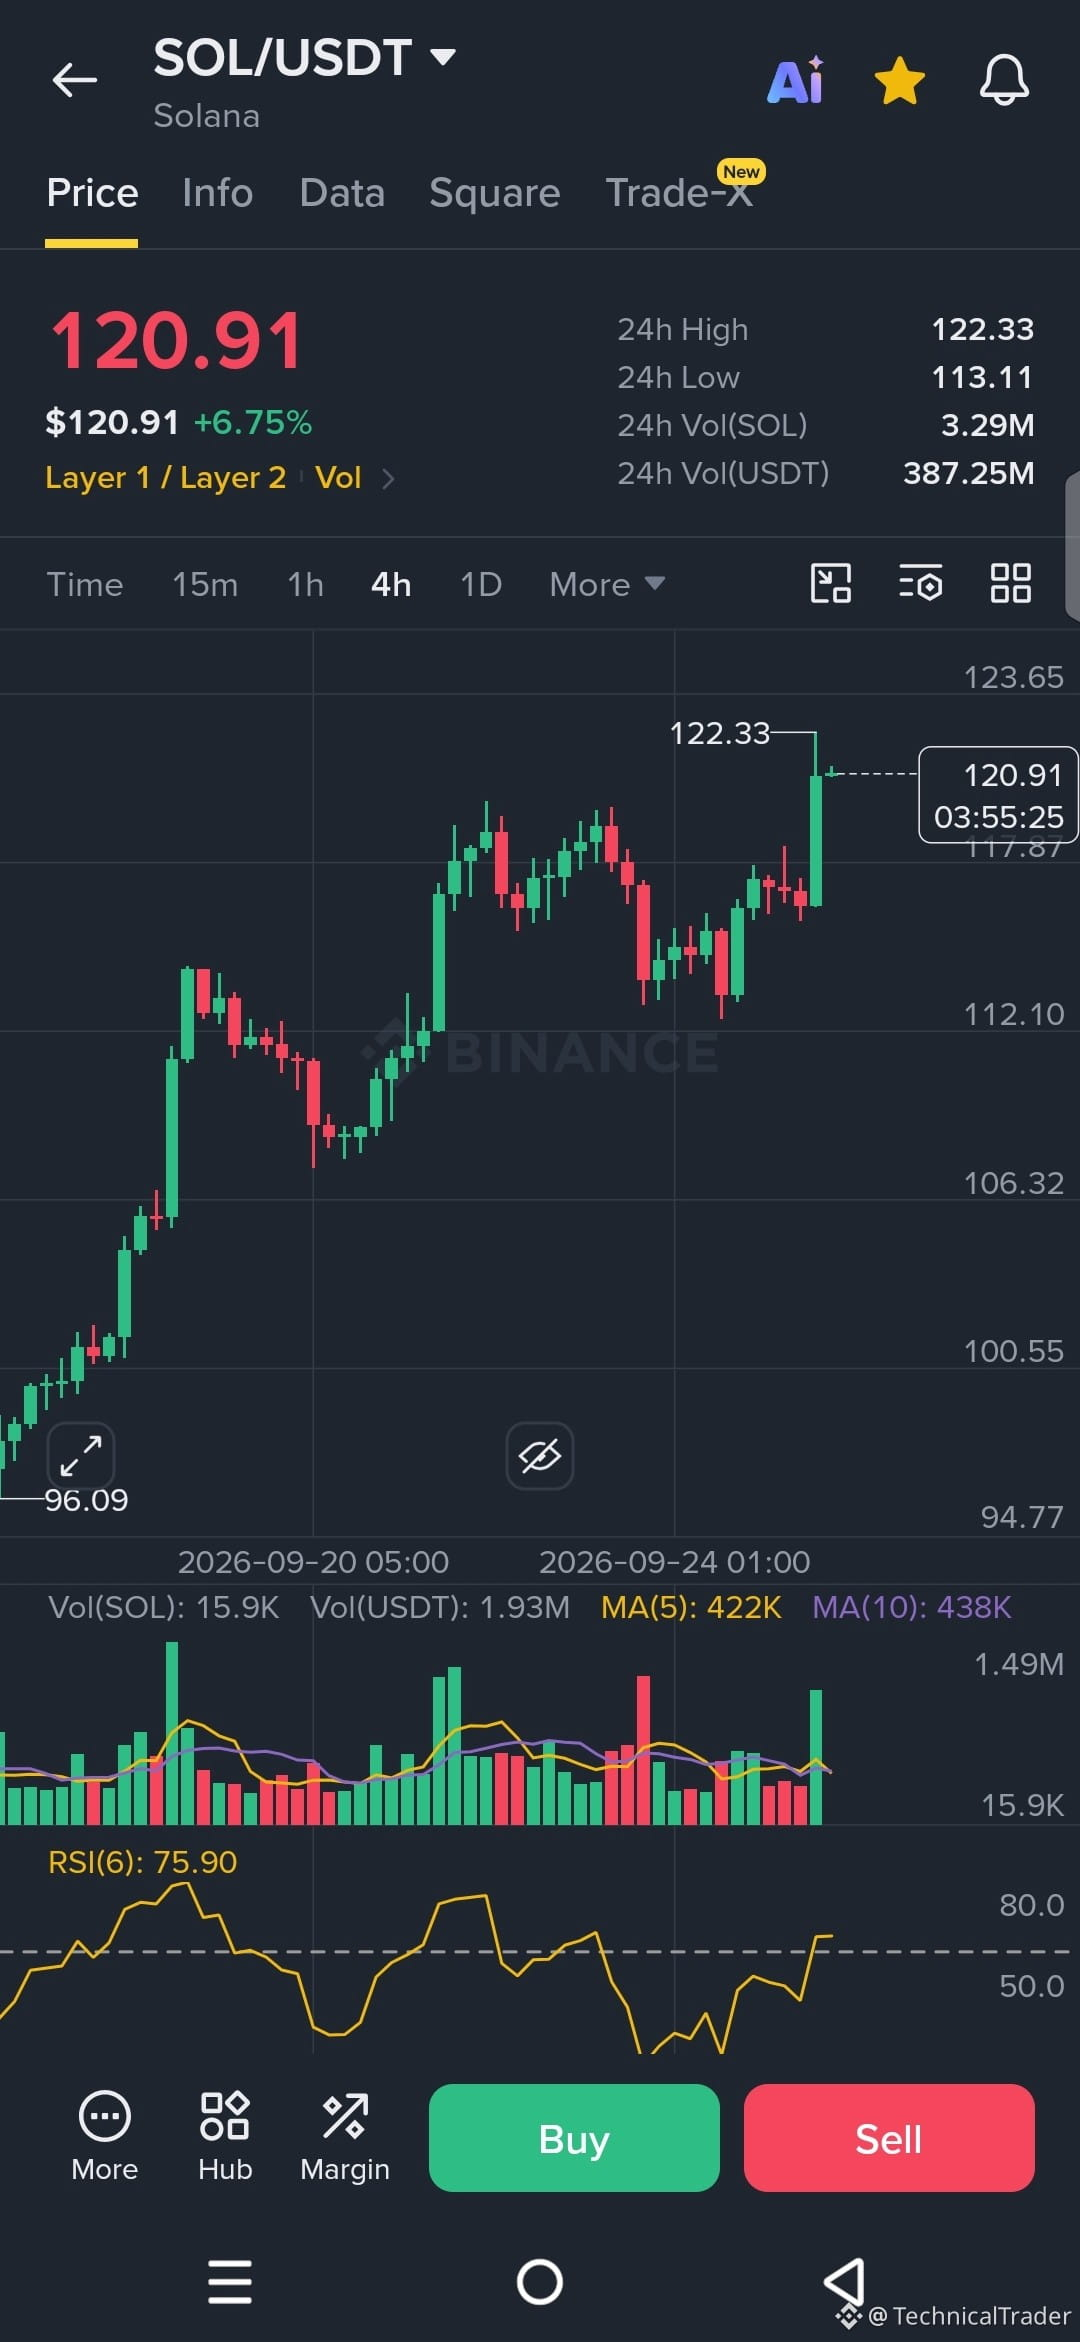
Guys, $SOL just printed a fresh high at 122.33 and is sitting at 120.91 right now.
Look at this 4h chart.
From the 96 area it has been making clear higher highs and higher lows the whole way up.
Strong impulsive green candles, healthy pullbacks, and buyers keep stepping in.
Right now price is consolidating just under that 122.33 high.
Volume is still decent and the last green candle showed real strength.
RSI(6) is sitting at 75.90 though.
That’s deep in overbought territory.
Here’s what I’m watching closely 👀
If bulls can push and close above 122.33 with volume, we could see another leg higher.
If price gets rejected here and starts printing lower highs, that 117–113 zone becomes the key area to watch on the downside.
Both sides are still in play.
Bullish case:
Hold above the recent structure and break 122.33 cleanly → continuation.
Bearish case:
Rejection at this high + RSI rolling over → deeper pullback toward previous demand.
This is the part I’m watching closely.
How price reacts right under 122.33 will tell us a lot.
Guys, follow for more chart analysis 😎 I’ll keep showing you exactly what the chart is telling us. 👀🔥
Look at this 4h chart.
From the 96 area it has been making clear higher highs and higher lows the whole way up.
Strong impulsive green candles, healthy pullbacks, and buyers keep stepping in.
Right now price is consolidating just under that 122.33 high.
Volume is still decent and the last green candle showed real strength.
RSI(6) is sitting at 75.90 though.
That’s deep in overbought territory.
Here’s what I’m watching closely 👀
If bulls can push and close above 122.33 with volume, we could see another leg higher.
If price gets rejected here and starts printing lower highs, that 117–113 zone becomes the key area to watch on the downside.
Both sides are still in play.
Bullish case:
Hold above the recent structure and break 122.33 cleanly → continuation.
Bearish case:
Rejection at this high + RSI rolling over → deeper pullback toward previous demand.
This is the part I’m watching closely.
How price reacts right under 122.33 will tell us a lot.
Guys, follow for more chart analysis 😎 I’ll keep showing you exactly what the chart is telling us. 👀🔥