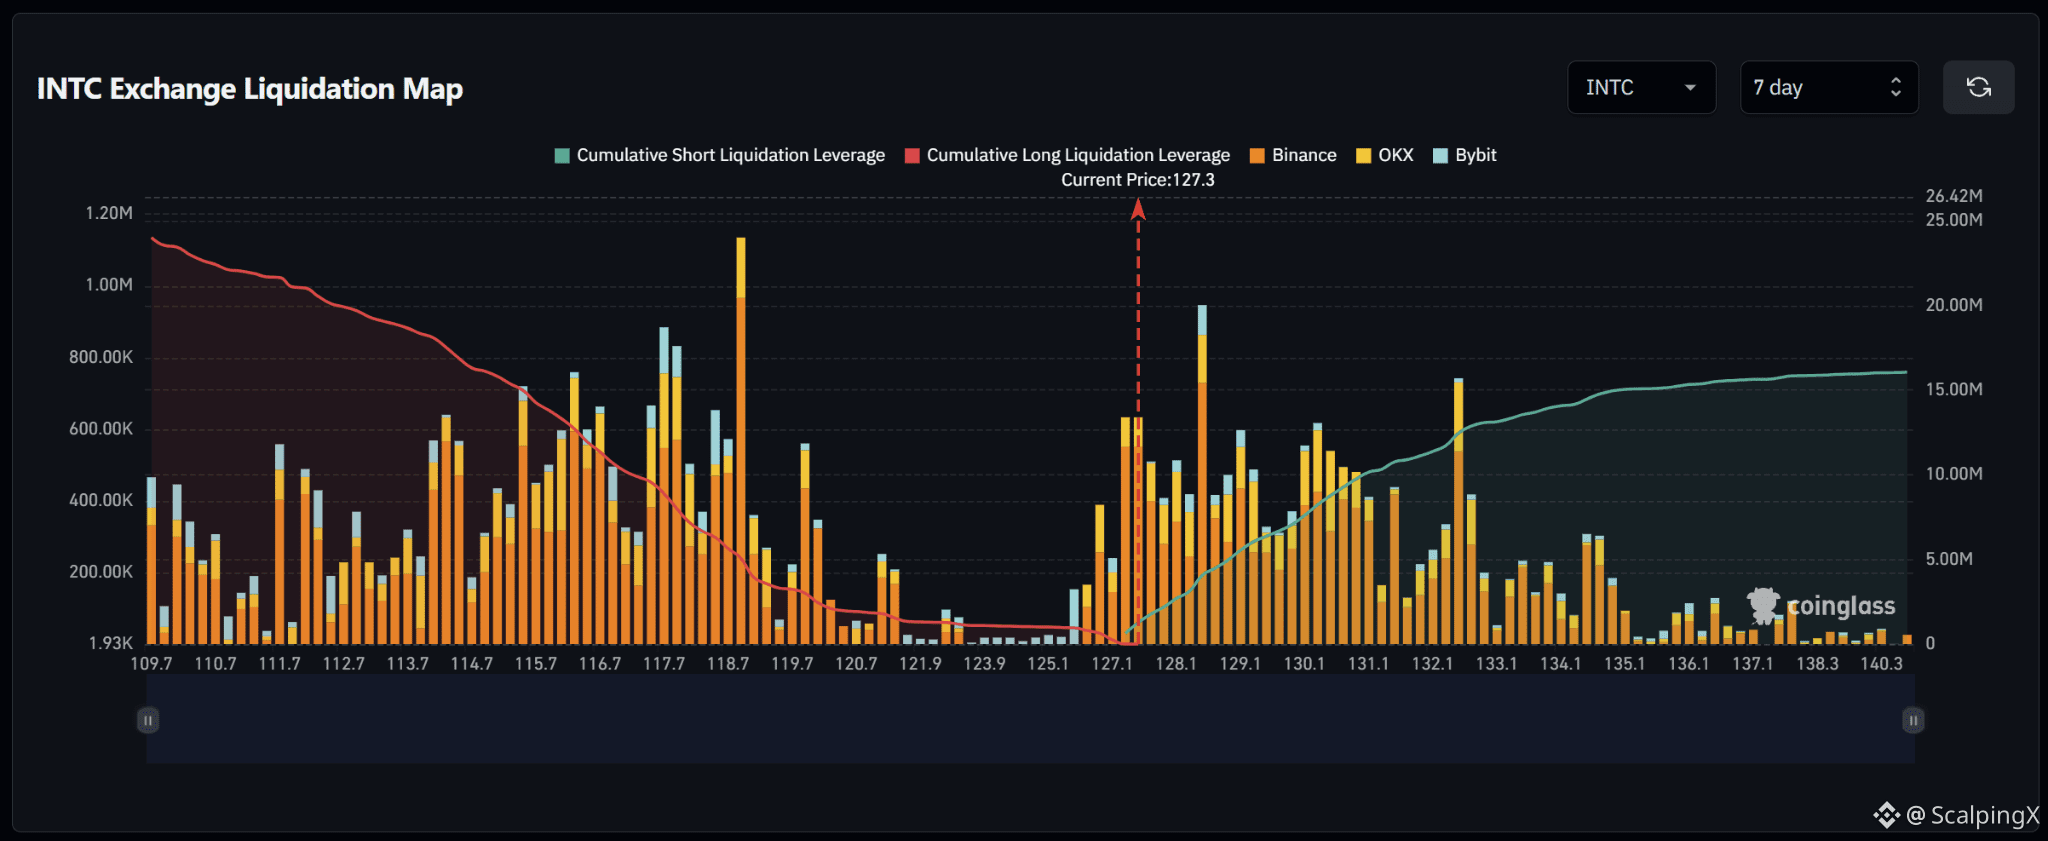
$INTC – Liquidation Map (7 Days) – Current Price 127.3
🔎 The 7-day liquidation map shows roughly $23–24 million in long liquidations below the current price, exceeding approximately $15–16 million in short liquidations above. The liquidity structure therefore favors the downside, with around 1.5 times more cumulative liquidity below the market.
📉 Below the market, long-liquidation liquidity is concentrated most heavily across 114–120. The strongest cluster sits around 118.7–119.0 with a bar above $1.1 million; the 117.5–118.0 area also contains several bars around $0.8–0.9 million, while 115.5–116.7 forms another relatively dense band. Liquidity between 121 and 125 is comparatively thin, so losing 125 could quickly shift attention toward 120–119 and then 118–117.
📈 Above the market, short-liquidation liquidity is concentrated mainly across 127–133. The strongest nearby cluster sits around 128.2–128.5 with a bar close to $0.95 million; 130–131 contains several bars around $0.5–0.6 million, while 132.2–132.5 holds another cluster near $0.7–0.75 million. Above 135, liquidity density declines noticeably.
🧭 The broader setup still favors the downside because long-liquidation exposure below is larger. Losing 125 would increase the probability of a sweep toward 120–119, followed by 118–117. Breaking above 128 would instead expose 128.5–131 and then 132–133.
🔎 The 7-day liquidation map shows roughly $23–24 million in long liquidations below the current price, exceeding approximately $15–16 million in short liquidations above. The liquidity structure therefore favors the downside, with around 1.5 times more cumulative liquidity below the market.
📉 Below the market, long-liquidation liquidity is concentrated most heavily across 114–120. The strongest cluster sits around 118.7–119.0 with a bar above $1.1 million; the 117.5–118.0 area also contains several bars around $0.8–0.9 million, while 115.5–116.7 forms another relatively dense band. Liquidity between 121 and 125 is comparatively thin, so losing 125 could quickly shift attention toward 120–119 and then 118–117.
📈 Above the market, short-liquidation liquidity is concentrated mainly across 127–133. The strongest nearby cluster sits around 128.2–128.5 with a bar close to $0.95 million; 130–131 contains several bars around $0.5–0.6 million, while 132.2–132.5 holds another cluster near $0.7–0.75 million. Above 135, liquidity density declines noticeably.
🧭 The broader setup still favors the downside because long-liquidation exposure below is larger. Losing 125 would increase the probability of a sweep toward 120–119, followed by 118–117. Breaking above 128 would instead expose 128.5–131 and then 132–133.