

What caught my attention with FET is not just the 11% rally.
It is where the rally has reached.
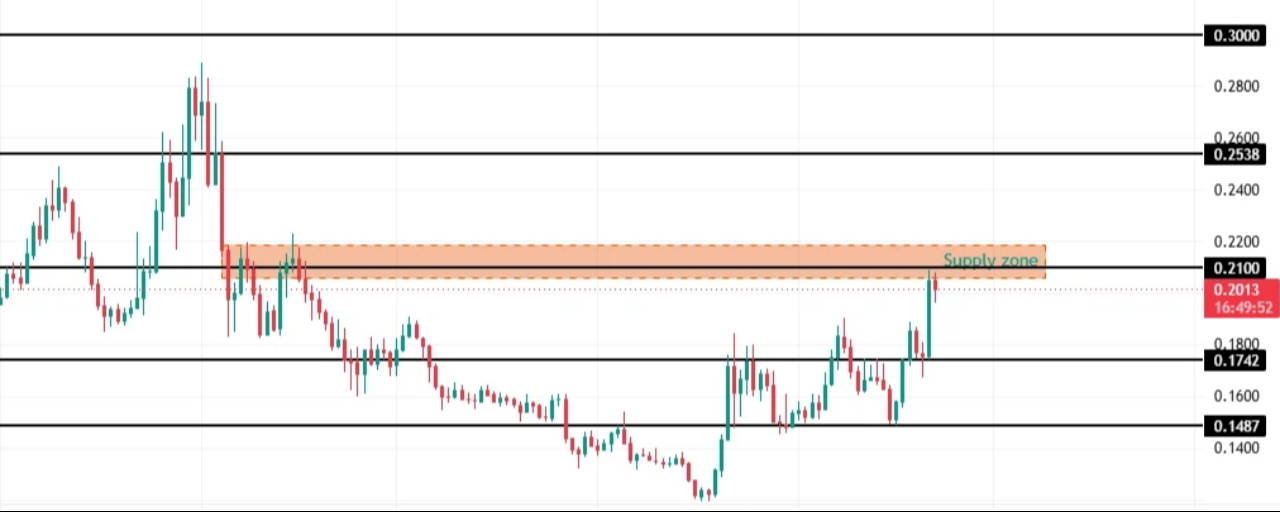
FET recovered from around $0.1742 and pushed toward the $0.21 area. That level now looks like the real test because it sits inside a broader supply zone where sellers have already shown interest.
The recovery itself has some decent participation behind it. Spot volume increased around 35.7% during the move. That is important because the price is not rising on completely empty activity.
But there is another detail I would not ignore.
Exchange reserves increased around 14% to roughly $41.7 million during the recovery.
That does not mean those tokens are being sold. Higher exchange reserves simply mean more FET is sitting where it can be sold more easily. When price is approaching a known supply zone that becomes more relevant.
Then there is the derivatives positioning.
Top traders were heavily tilted toward longs with around 72.9% long accounts compared with 27.1% shorts. The Long Short Ratio reached about 2.69 while OI Weighted Funding moved to 0.0166%.
That tells me traders are expecting continuation.
But crowded longs can become a problem around resistance.
If FET breaks $0.21 and holds above it then the structure becomes much more interesting. The next resistance I would watch is around $0.2538.
The MACD is also supporting the current momentum. The MACD line remained above the signal line while the green histogram expanded.
Still I would separate momentum from confirmation.
A strong MACD does not automatically mean the $0.21 supply will disappear.
For me the clean signal is a daily close above $0.21 followed by a successful retest.
If that happens then buyers have actually absorbed the supply.
If FET gets rejected there then $0.1742 becomes the level I would watch again.
The rally is strong.
Now FET needs to prove that buyers can handle the sellers waiting around $0.21.