$BTC
🚨Bitcoin Price Analysis: BTC Eyes $90K After Breaking Above $84K🚨
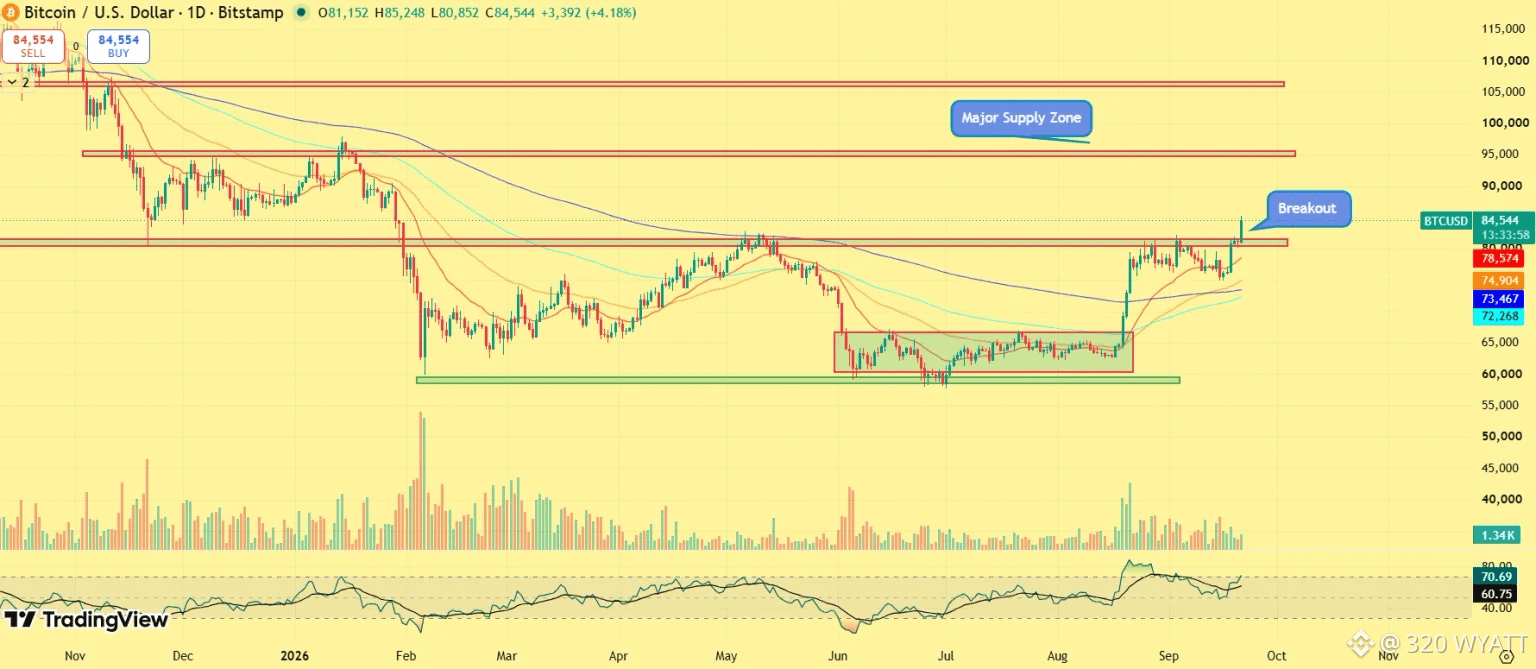
Bitcoin’s price chart shows a breakout above the $84,000–$84,500 resistance zone, supported by increased trading activity. The region now becomes an important area to monitor for support. Bitcoin’s recovery above $80,061, its reported one-year moving average, marks an important development in the broader chart structure. The reclaim suggests that BTC has moved back above a key trend reference after facing pressure during previous sessions.
Holding above it would preserve the current bullish structure, while a sustained move back below $84,000 could signal a failed breakout and expose BTC to renewed consolidation. On the upside, the $88,761 two-year moving average is the next major technical reference, followed by the psychological $90,000 resistance.
A decisive daily close above this zone could strengthen the recovery structure. Conversely, rejection near the higher resistance area may trigger profit-taking and a retest of the $80,000 region, where the one-year moving average could provide initial support.
#BTC320 #Trendingissue #WriteToEarn2026 #Btchit85k #mr320
🚨Bitcoin Price Analysis: BTC Eyes $90K After Breaking Above $84K🚨
Bitcoin’s price chart shows a breakout above the $84,000–$84,500 resistance zone, supported by increased trading activity. The region now becomes an important area to monitor for support. Bitcoin’s recovery above $80,061, its reported one-year moving average, marks an important development in the broader chart structure. The reclaim suggests that BTC has moved back above a key trend reference after facing pressure during previous sessions.
Holding above it would preserve the current bullish structure, while a sustained move back below $84,000 could signal a failed breakout and expose BTC to renewed consolidation. On the upside, the $88,761 two-year moving average is the next major technical reference, followed by the psychological $90,000 resistance.
A decisive daily close above this zone could strengthen the recovery structure. Conversely, rejection near the higher resistance area may trigger profit-taking and a retest of the $80,000 region, where the one-year moving average could provide initial support.
#BTC320 #Trendingissue #WriteToEarn2026 #Btchit85k #mr320