#bitcoin
🚀 Bitcoin Crosses the 50-Week Moving
Average: Is the Bear Retreating or Is It a Trap?
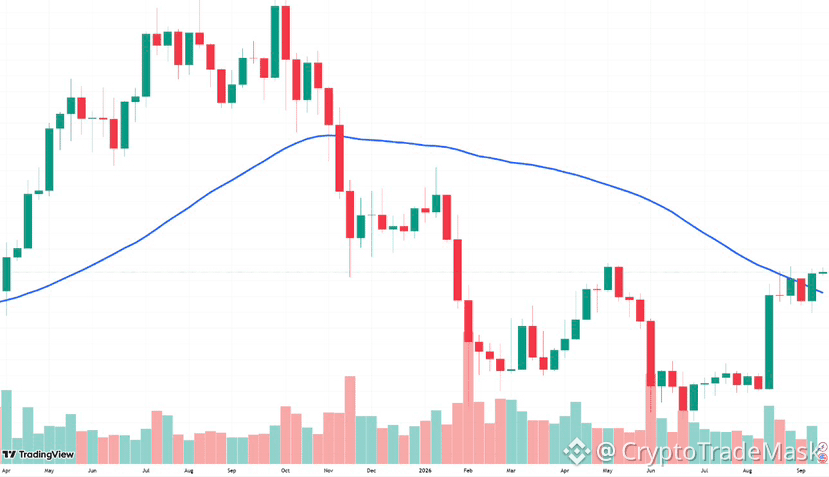
On Sunday, $BTC closed the week at $81,159 (Coinbase), rising above the 50-week moving average (50w MA) of $78,788 for the first time in 10 months.
In past cycles, this has almost always signaled the end of a bear market and the start of a new rally. However, analysts advise against jumping to conclusions:
📈 Bullish Scenario:
➡️ Galaxy Research: In 4 out of 5 past cycles, breaking above the 50w MA marked the definitive bottom.
➡️ Collective Shift: Highlights that in 2017, 2020, and 2023, Bitcoin surged 700–900% after clearing this level.
➡️ Bitget: Notes that the market has shed excessive leverage and institutional demand is gradually returning.
‼️ Risks and Caution:
➡️ False Signals: Historically, out of 13 such crossovers, two proved false (both during the 2021–2022 downturn). A single weekly close above the level isn't a 100% guarantee; maintaining the price above it and establishing higher lows is crucial.
➡️ Alternative View: Trader Craig Cobb identifies the $83,000 mark as key—only by breaking this level will the downtrend on the monthly chart be broken. Additionally, he is awaiting confirmation on the 3-month timeframe at the end of September.
⚠️ Bottom line: The market is clearly showing strong signs of recovery from the July lows ($57,000), but the macroeconomic backdrop could still spring some surprises.
🚀 Bitcoin Crosses the 50-Week Moving
Average: Is the Bear Retreating or Is It a Trap?
On Sunday, $BTC closed the week at $81,159 (Coinbase), rising above the 50-week moving average (50w MA) of $78,788 for the first time in 10 months.
In past cycles, this has almost always signaled the end of a bear market and the start of a new rally. However, analysts advise against jumping to conclusions:
📈 Bullish Scenario:
➡️ Galaxy Research: In 4 out of 5 past cycles, breaking above the 50w MA marked the definitive bottom.
➡️ Collective Shift: Highlights that in 2017, 2020, and 2023, Bitcoin surged 700–900% after clearing this level.
➡️ Bitget: Notes that the market has shed excessive leverage and institutional demand is gradually returning.
‼️ Risks and Caution:
➡️ False Signals: Historically, out of 13 such crossovers, two proved false (both during the 2021–2022 downturn). A single weekly close above the level isn't a 100% guarantee; maintaining the price above it and establishing higher lows is crucial.
➡️ Alternative View: Trader Craig Cobb identifies the $83,000 mark as key—only by breaking this level will the downtrend on the monthly chart be broken. Additionally, he is awaiting confirmation on the 3-month timeframe at the end of September.
⚠️ Bottom line: The market is clearly showing strong signs of recovery from the July lows ($57,000), but the macroeconomic backdrop could still spring some surprises.