$BTC
📊 BTC/USDT — Bearish Perspective
🔴 Regular Bearish Divergence — Daily: Price is making higher highs while the RSI is forming lower highs, indicating that bullish momentum is weakening despite the price advance.
🟠 Hidden Bearish Divergence — Weekly: The weekly structure shows a bearish divergence between price action and RSI, suggesting that downside continuation remains a possibility if momentum fails to strengthen.
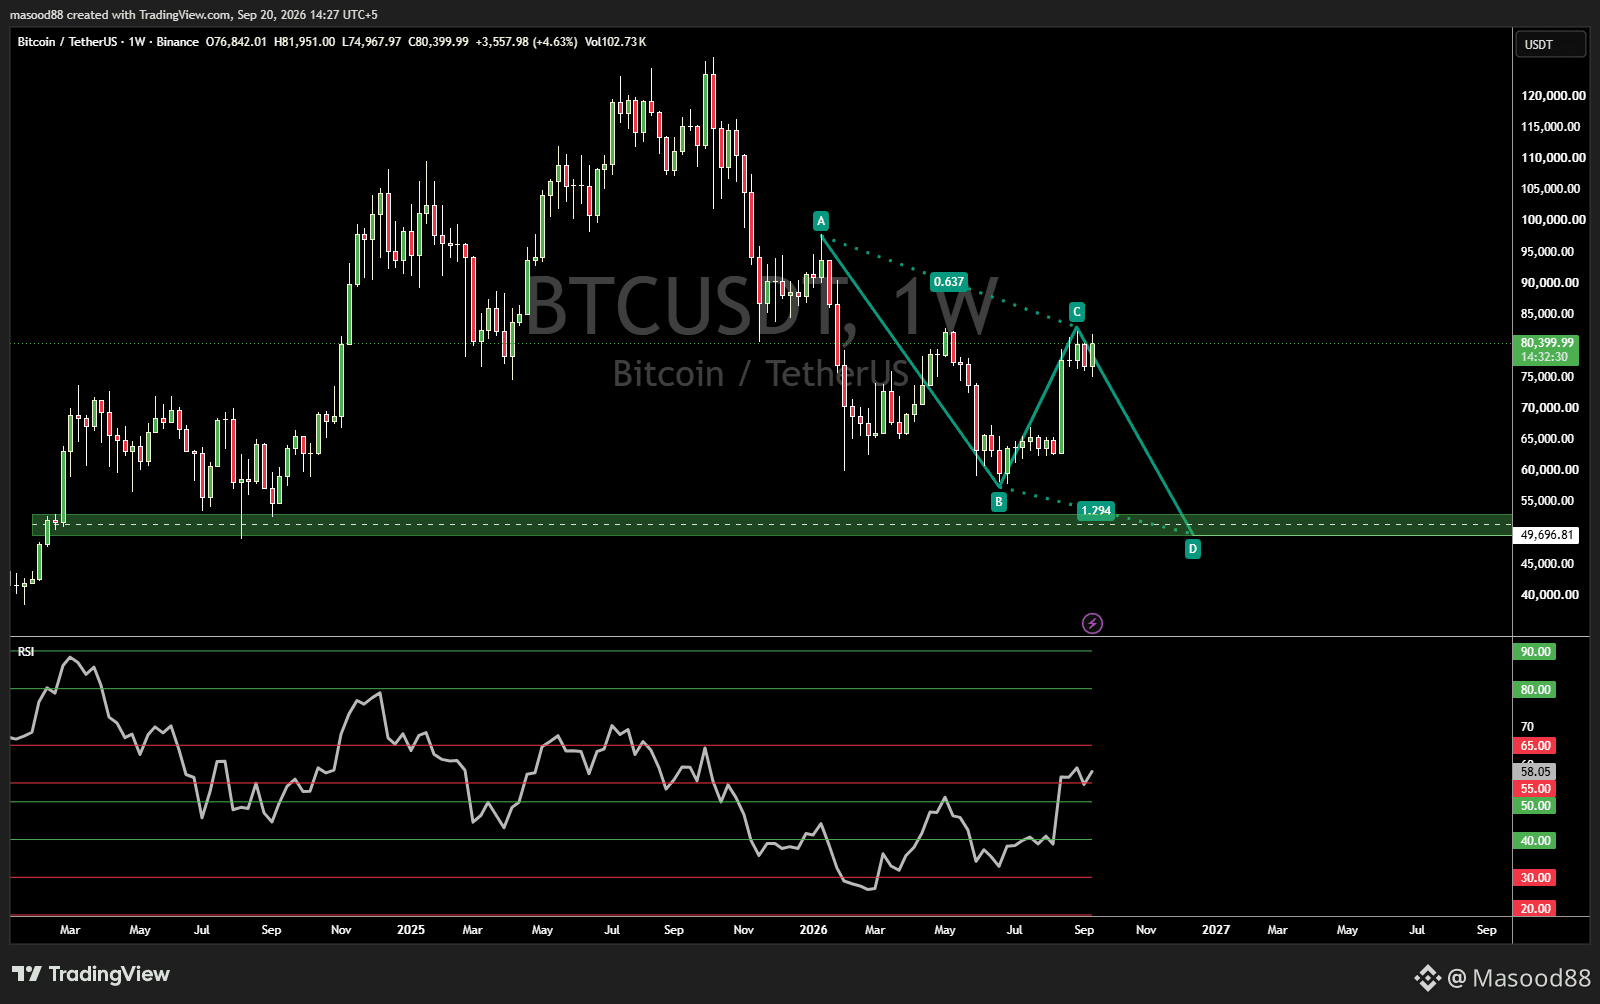
🔴 Strong Resistance at Current Price: BTC is approaching a significant resistance area around $83,000–$88,000. A rejection from this zone could increase selling pressure.
🟢 Weekly RSI in Sell-Resistance Zone: Weekly RSI is hovering around the 60–65 area, which has previously acted as an important resistance region for momentum.
⚠️ Overall Perspective: The combination of daily bearish divergence + weekly bearish divergence + major resistance + elevated weekly RSI creates a technically cautious setup. It does not guarantee a reversal, but it increases the importance of watching for rejection and confirmation.
🎯 Downside Area to Watch: If BTC is rejected from resistance and selling accelerates, the $49,000–$52,000 support zone becomes an important area to monitor.
🚀 Invalidation: A decisive breakout and sustained weekly acceptance above the $88,000 resistance area would weaken this bearish thesis and indicate that the market structure needs to be reassessed.
#BTCBreaks80K #SOLJumpsAbout10% #HKCompletesFirstHKDStablecoinUseCase #VietnamPlansFirstCryptoLicensesIn2026 #XRPExchangeReservesHitSevenYearLow
📊 BTC/USDT — Bearish Perspective
🔴 Regular Bearish Divergence — Daily: Price is making higher highs while the RSI is forming lower highs, indicating that bullish momentum is weakening despite the price advance.
🟠 Hidden Bearish Divergence — Weekly: The weekly structure shows a bearish divergence between price action and RSI, suggesting that downside continuation remains a possibility if momentum fails to strengthen.
🔴 Strong Resistance at Current Price: BTC is approaching a significant resistance area around $83,000–$88,000. A rejection from this zone could increase selling pressure.
🟢 Weekly RSI in Sell-Resistance Zone: Weekly RSI is hovering around the 60–65 area, which has previously acted as an important resistance region for momentum.
⚠️ Overall Perspective: The combination of daily bearish divergence + weekly bearish divergence + major resistance + elevated weekly RSI creates a technically cautious setup. It does not guarantee a reversal, but it increases the importance of watching for rejection and confirmation.
🎯 Downside Area to Watch: If BTC is rejected from resistance and selling accelerates, the $49,000–$52,000 support zone becomes an important area to monitor.
🚀 Invalidation: A decisive breakout and sustained weekly acceptance above the $88,000 resistance area would weaken this bearish thesis and indicate that the market structure needs to be reassessed.
#BTCBreaks80K #SOLJumpsAbout10% #HKCompletesFirstHKDStablecoinUseCase #VietnamPlansFirstCryptoLicensesIn2026 #XRPExchangeReservesHitSevenYearLow