🚨 MYX JUST WOKE UP AND CHOSE VIOLENCE! 😂🔥
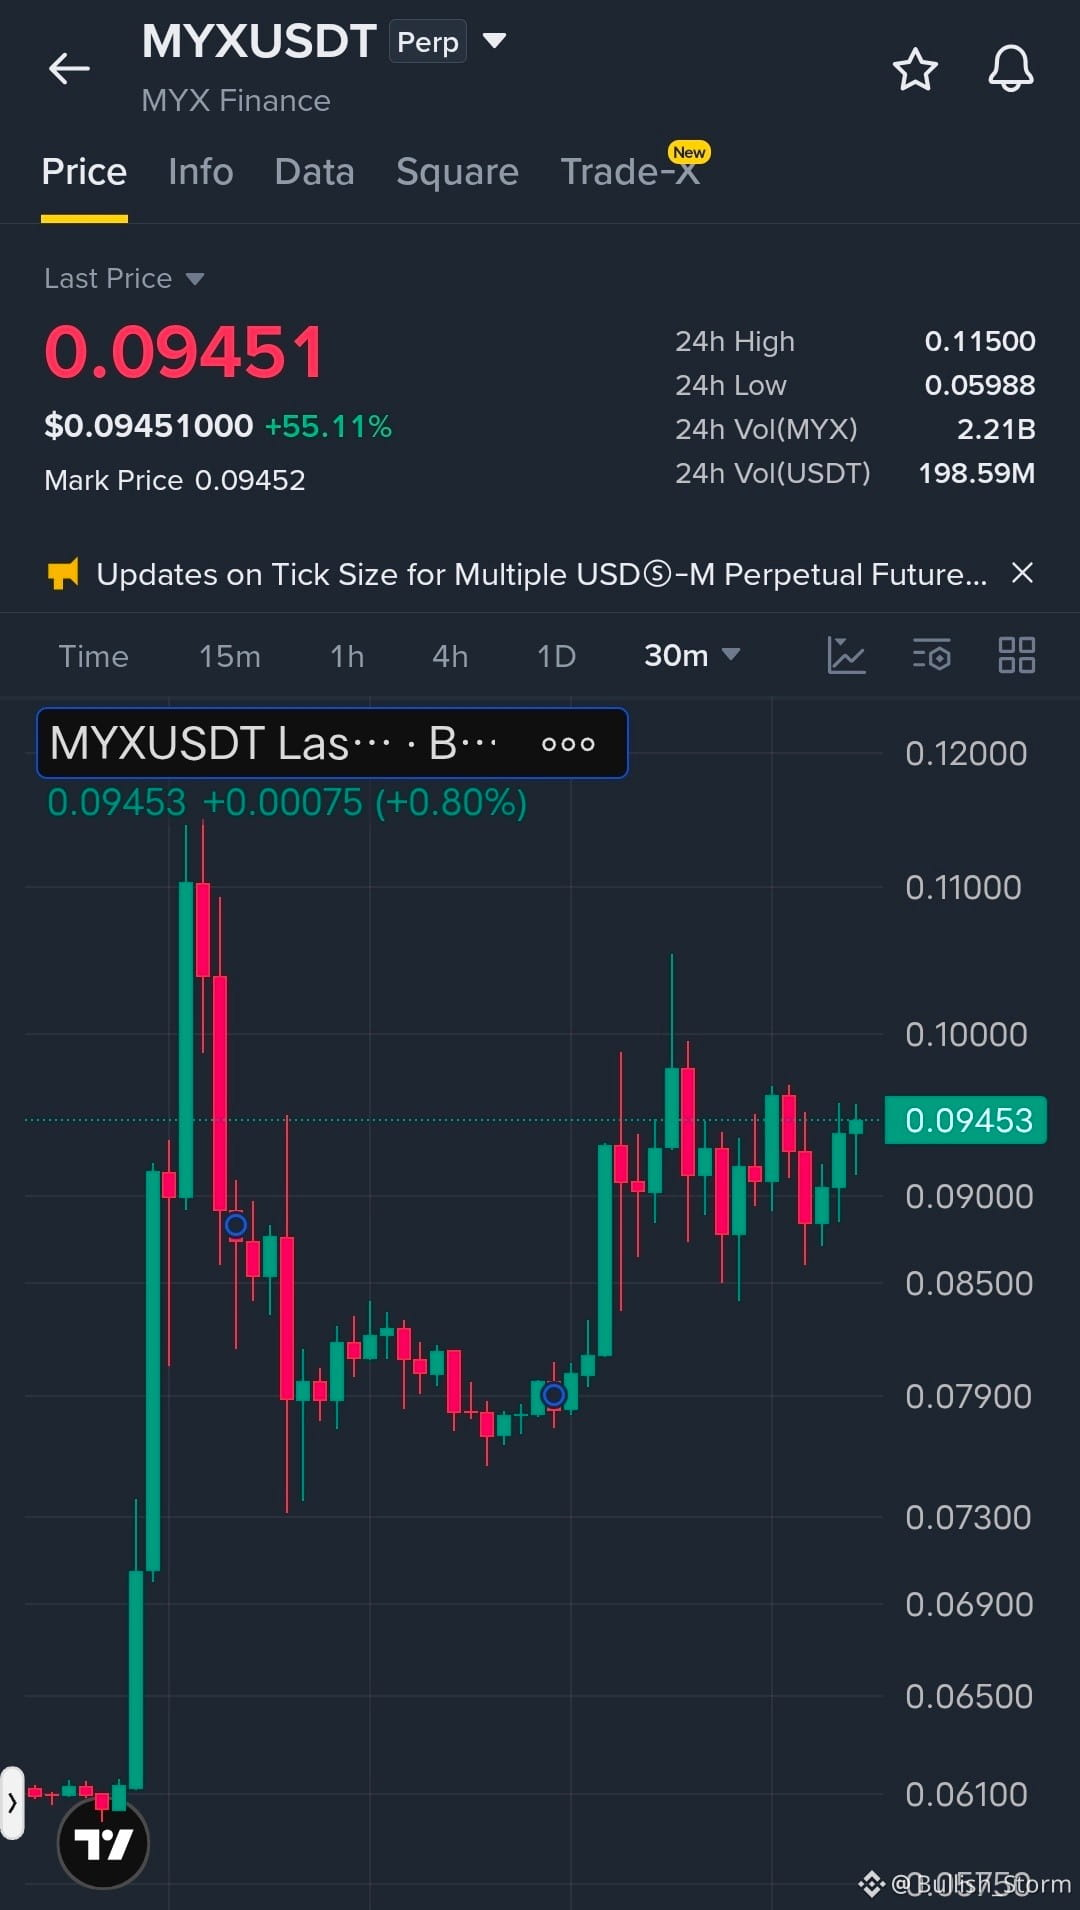
Look at $MYXUSDT on the 30M chart… this move is getting seriously interesting.
MYX is sitting around $0.0945, showing a massive +55% move in 24H. And the crazy part? Price went from around $0.060 to as high as $0.115 before cooling off.
That’s not a pump…
That’s MYX basically saying:
“I was sleeping. What did I miss?” 😂💀
After the huge breakout, price pulled back hard, but buyers didn’t completely disappear. Instead, the chart started building a consolidation zone around $0.088–$0.097, with several attempts to push higher.
🔥 The levels I’m watching:
🟢 Support: $0.090–$0.088
🟢 Stronger support: $0.085–$0.079
🔴 Resistance: $0.098–$0.100
🔴 Major resistance: $0.105–$0.115
If MYX can reclaim and hold above the $0.098–$0.100 area, the market could start watching the previous $0.105–$0.115 zone again.
But here’s the dangerous part 👀
After a 55%+ daily move, chasing green candles can be like running behind a speeding car and thinking it will stop for you. 😂
If buyers lose the $0.088–$0.090 area, a deeper pullback toward the lower support zones becomes possible.
For now, the chart looks like a battle between FOMO buyers and profit-takers.
And honestly… after seeing a move like this, you already know Crypto Twitter is about to produce:
📈 100x predictions
🚀 “Next moonshot” posts
😂 People buying the top
💀 People selling the bottom
🧠 And one guy saying, “I told you yesterday.”
MYX is definitely one to watch. The next breakout or breakdown could make this chart VERY interesting. 👀🔥
Not financial advice. Trade with a plan, manage risk, and never chase a candle just because it looks beautiful.
$B2
$AKE
$MYX
Look at $MYXUSDT on the 30M chart… this move is getting seriously interesting.
MYX is sitting around $0.0945, showing a massive +55% move in 24H. And the crazy part? Price went from around $0.060 to as high as $0.115 before cooling off.
That’s not a pump…
That’s MYX basically saying:
“I was sleeping. What did I miss?” 😂💀
After the huge breakout, price pulled back hard, but buyers didn’t completely disappear. Instead, the chart started building a consolidation zone around $0.088–$0.097, with several attempts to push higher.
🔥 The levels I’m watching:
🟢 Support: $0.090–$0.088
🟢 Stronger support: $0.085–$0.079
🔴 Resistance: $0.098–$0.100
🔴 Major resistance: $0.105–$0.115
If MYX can reclaim and hold above the $0.098–$0.100 area, the market could start watching the previous $0.105–$0.115 zone again.
But here’s the dangerous part 👀
After a 55%+ daily move, chasing green candles can be like running behind a speeding car and thinking it will stop for you. 😂
If buyers lose the $0.088–$0.090 area, a deeper pullback toward the lower support zones becomes possible.
For now, the chart looks like a battle between FOMO buyers and profit-takers.
And honestly… after seeing a move like this, you already know Crypto Twitter is about to produce:
📈 100x predictions
🚀 “Next moonshot” posts
😂 People buying the top
💀 People selling the bottom
🧠 And one guy saying, “I told you yesterday.”
MYX is definitely one to watch. The next breakout or breakdown could make this chart VERY interesting. 👀🔥
Not financial advice. Trade with a plan, manage risk, and never chase a candle just because it looks beautiful.
$B2
$AKE
$MYX