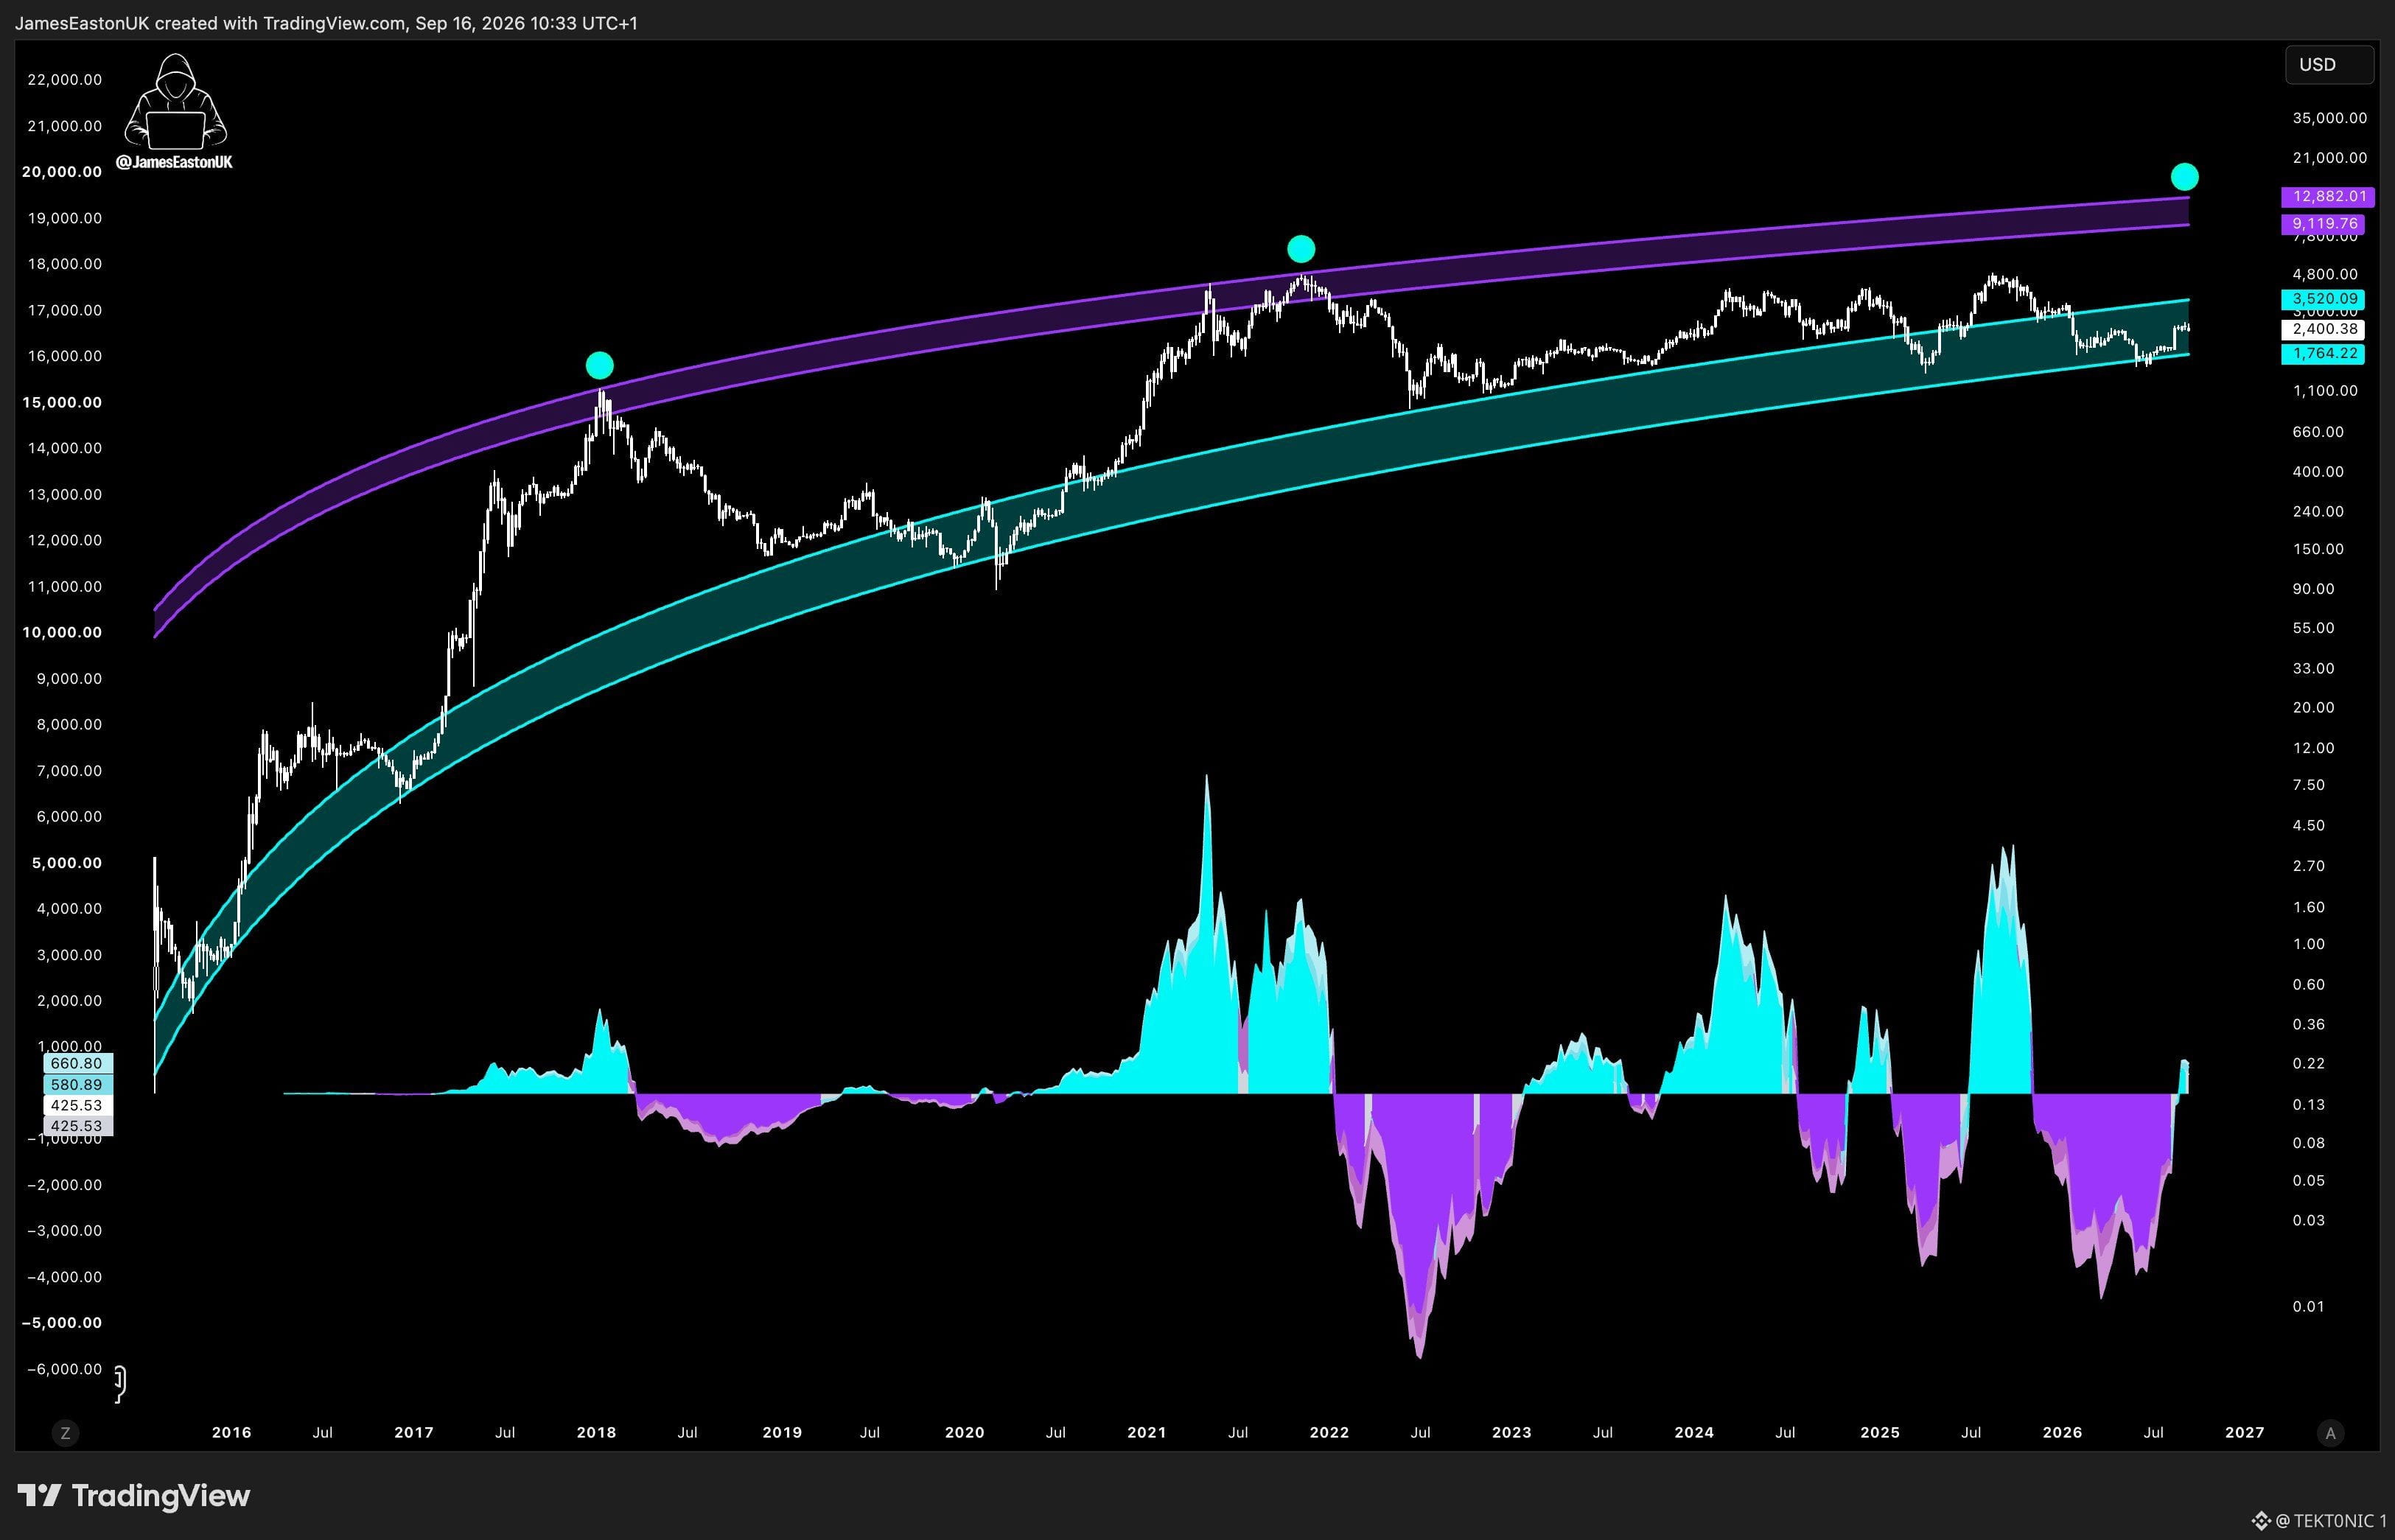
Ether Is Sitting on Multi-Year Support. The Next Major Ceiling on This Chart Is $12,000. That $12,000 line is where prior bull-market tops landed. It is not the next stop from here. According to the long-term chart, $ETH is holding a rising support zone around $1,760–$3,520. Every major cycle high since 2018 tagged the upper resistance band, now near $9,120–$12,880. Price is back on support after the drop from the last peak. Traders using this overlay say a full bull leg would take Ether toward that $12,000 resistance again. First it has to clear $3,000 and hold it. Key Details: > Support zone now: about $1,760–$3,520. > Resistance zone / stretch target: about $9,120–$12,880. > Prior cycle highs sat on that upper band. > Nearest level that matters in dollars: $3,000. Support means buyers have defended this area before. Resistance means sellers showed up there at old tops. A channel like this is a guide for where those zones sit as time passes. It does not replace Bitcoin holding $76,000–$83,000. If Bitcoin breaks down, Ether can lose this support even if the long-term lines still look neat. ETH Support $1.8K–$3.5K. Stretch Resistance $9K–$13K. $3,000 First. Do you buy $ETH on this support, or do you wait for a weekly close above $3,000 before targeting $12,000? #BTC Price Analysis# #Bitcoin Price Prediction: What is Bitcoins next move?# $BTC

投稿