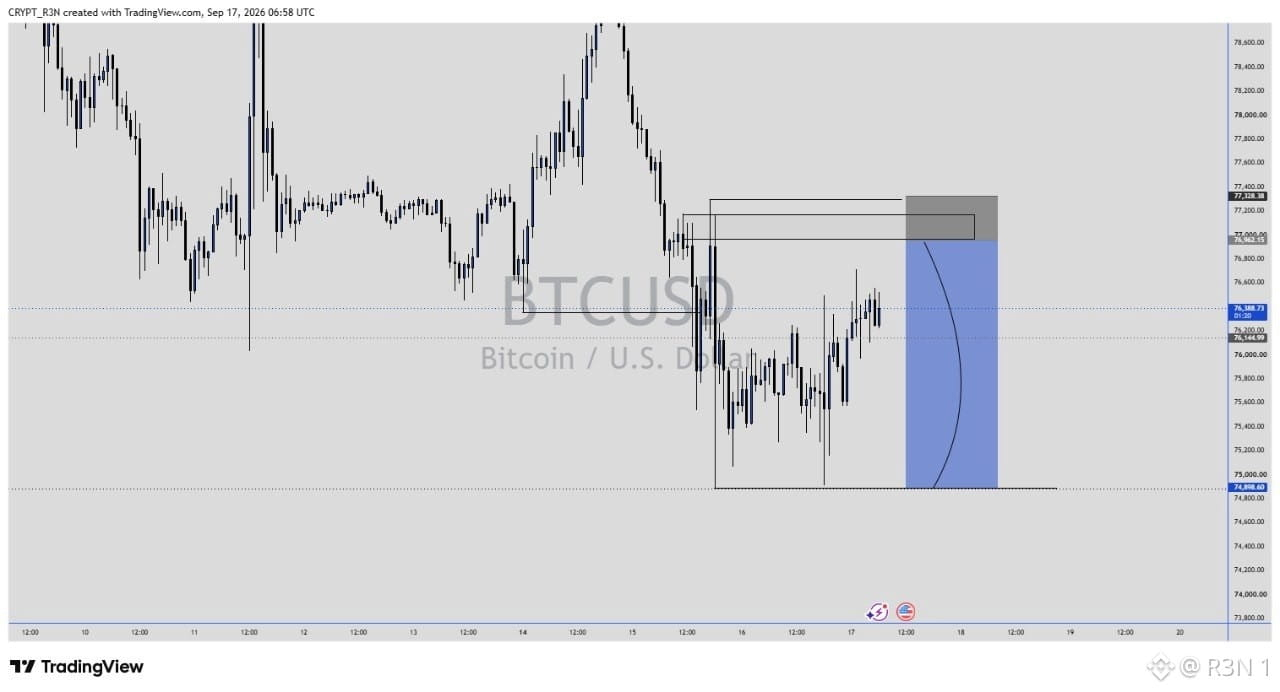
BTC's currently bouncing at $76,388.73, right in the middle of the exact range this chart's been building since the Fed decision hit two days ago.
The sharp dip into $75,000 to $75,800 that I've marked as support here lines up directly with Wednesday's rate hike and Warsh's hawkish press conference, the same drop that pulled BTC down alongside stocks, oil, and gold that day. Price found a floor right around $74,898.60 and has been recovering since, currently sitting well off that low but still stuck below the $76,962 to $77,328 zone I've marked as resistance, the same shelf that capped price on the way down before the Fed reaction even started.
What the structure actually shows is a market that's recovered roughly half of the Fed day drop without yet reclaiming the level it broke down from. That's a meaningfully different position than either a full recovery or a continued breakdown, it's sitting right at the decision point. The arc I've drawn projecting forward into Thursday reflects that tension, this is the zone where the next real move gets decided, not a level BTC's already resolved through.
My honest read: this bounce off $75,000 support is constructive on its own, a defined low that's held and a clean reversal off it. But the resistance zone directly above current price is the actual test, not the bounce itself. Reclaiming $76,962 to $77,328 would put BTC back above where it traded before the Fed reaction, essentially erasing that specific drop. Failing there and rolling back down would suggest the Fed day selloff still has unfinished business.
What I'm watching: whether price pushes through that $77,000 area with real follow through in the next session, or whether it stalls and retests the $75,000 low again.
$BTC #BTC Price Analysis# #Meme Alpha#
The sharp dip into $75,000 to $75,800 that I've marked as support here lines up directly with Wednesday's rate hike and Warsh's hawkish press conference, the same drop that pulled BTC down alongside stocks, oil, and gold that day. Price found a floor right around $74,898.60 and has been recovering since, currently sitting well off that low but still stuck below the $76,962 to $77,328 zone I've marked as resistance, the same shelf that capped price on the way down before the Fed reaction even started.
What the structure actually shows is a market that's recovered roughly half of the Fed day drop without yet reclaiming the level it broke down from. That's a meaningfully different position than either a full recovery or a continued breakdown, it's sitting right at the decision point. The arc I've drawn projecting forward into Thursday reflects that tension, this is the zone where the next real move gets decided, not a level BTC's already resolved through.
My honest read: this bounce off $75,000 support is constructive on its own, a defined low that's held and a clean reversal off it. But the resistance zone directly above current price is the actual test, not the bounce itself. Reclaiming $76,962 to $77,328 would put BTC back above where it traded before the Fed reaction, essentially erasing that specific drop. Failing there and rolling back down would suggest the Fed day selloff still has unfinished business.
What I'm watching: whether price pushes through that $77,000 area with real follow through in the next session, or whether it stalls and retests the $75,000 low again.
$BTC #BTC Price Analysis# #Meme Alpha#