DYDX: Structural Breakdown of Compression Triangle – Strategic Retest Short Below Dynamic MA100 Targeting $0.050 Baseline
dYdX (DYDX) is confirming a decisive bearish continuation breakdown on the daily timeframe following an impulsive daily candle close beneath the lower boundary of its multi-week consolidation triangle. While price action is currently staging a minor bounce after testing the critical $0.100 psychological round-number floor, this relief move represents a temporary technical reset rather than genuine structural accumulation.
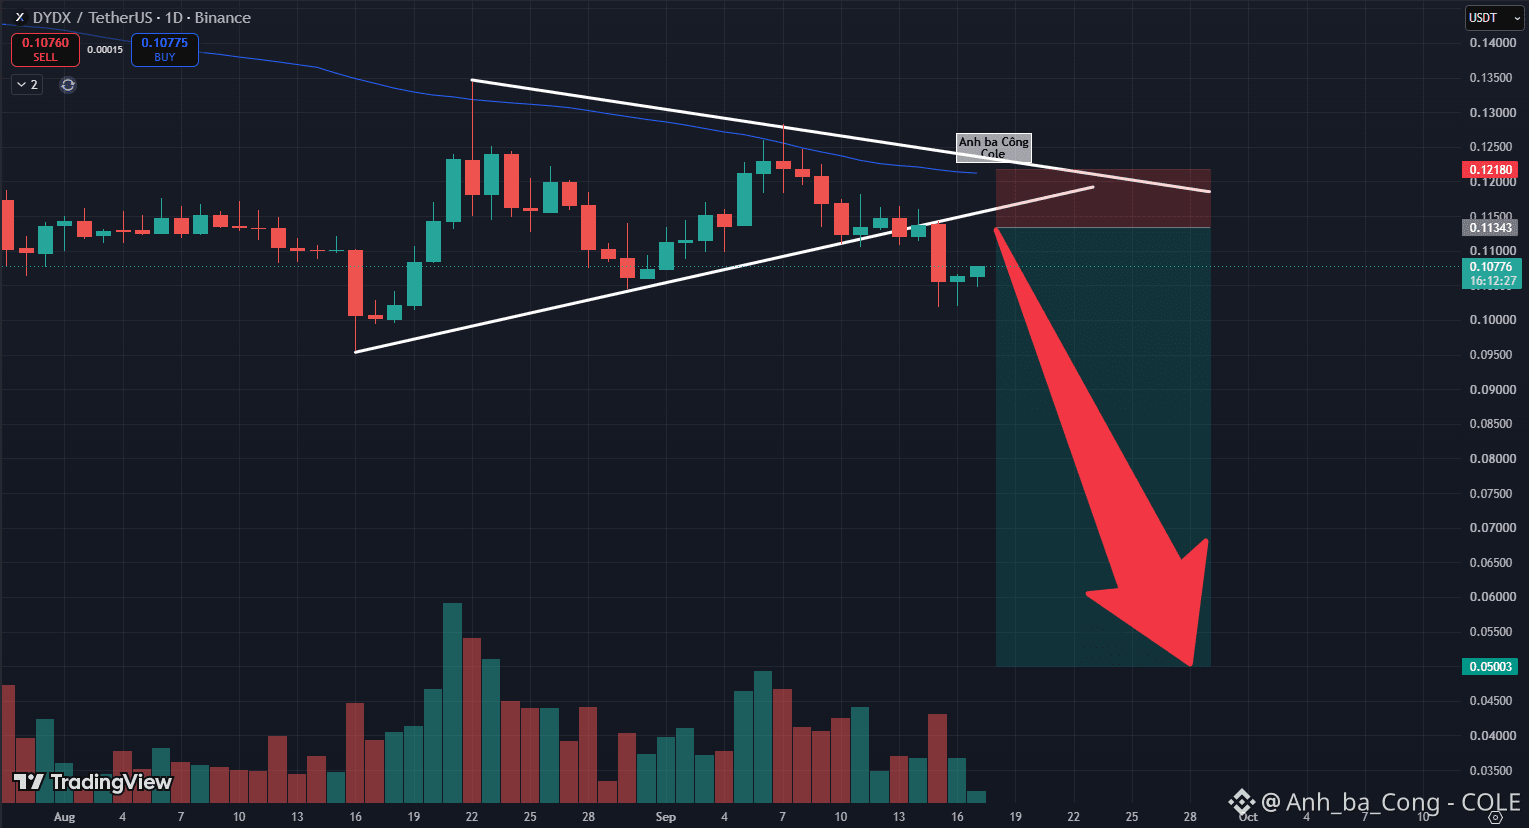
Based on the visual data from the daily chart , the preceding breakdown candle systematically invalidated the series of ascending higher lows, pushing price action securely beneath the downward-sloping dynamic MA100 trendline. Current price candles near the $0.107 handle exhibit subdued buying volume, lacking the momentum necessary to reclaim the lost triangle baseline. Residual dip-buying interest has been thoroughly overpowered by dominant sell-side distribution. With the former ascending support line now flipping into a formidable overhead resistance ceiling, technical odds heavily favor an expansive downward extension resuming the primary macro downtrend.
The most disciplined trading strategy is to await a corrective retest of the broken triangle boundary within the $0.113–$0.118 zone to execute a trend-continuation Short. A tight protective stop-loss parameter should be placed above the dynamic MA100 resistance band at $0.1218. The primary strategic take-profit objective targets the macro liquidity floor near $0.0500, securing superior risk-to-reward metrics.
Disclaimer: This is not financial advice, DYOR. $DYDX $BR $ONE
dYdX (DYDX) is confirming a decisive bearish continuation breakdown on the daily timeframe following an impulsive daily candle close beneath the lower boundary of its multi-week consolidation triangle. While price action is currently staging a minor bounce after testing the critical $0.100 psychological round-number floor, this relief move represents a temporary technical reset rather than genuine structural accumulation.
Based on the visual data from the daily chart , the preceding breakdown candle systematically invalidated the series of ascending higher lows, pushing price action securely beneath the downward-sloping dynamic MA100 trendline. Current price candles near the $0.107 handle exhibit subdued buying volume, lacking the momentum necessary to reclaim the lost triangle baseline. Residual dip-buying interest has been thoroughly overpowered by dominant sell-side distribution. With the former ascending support line now flipping into a formidable overhead resistance ceiling, technical odds heavily favor an expansive downward extension resuming the primary macro downtrend.
The most disciplined trading strategy is to await a corrective retest of the broken triangle boundary within the $0.113–$0.118 zone to execute a trend-continuation Short. A tight protective stop-loss parameter should be placed above the dynamic MA100 resistance band at $0.1218. The primary strategic take-profit objective targets the macro liquidity floor near $0.0500, securing superior risk-to-reward metrics.
Disclaimer: This is not financial advice, DYOR. $DYDX $BR $ONE