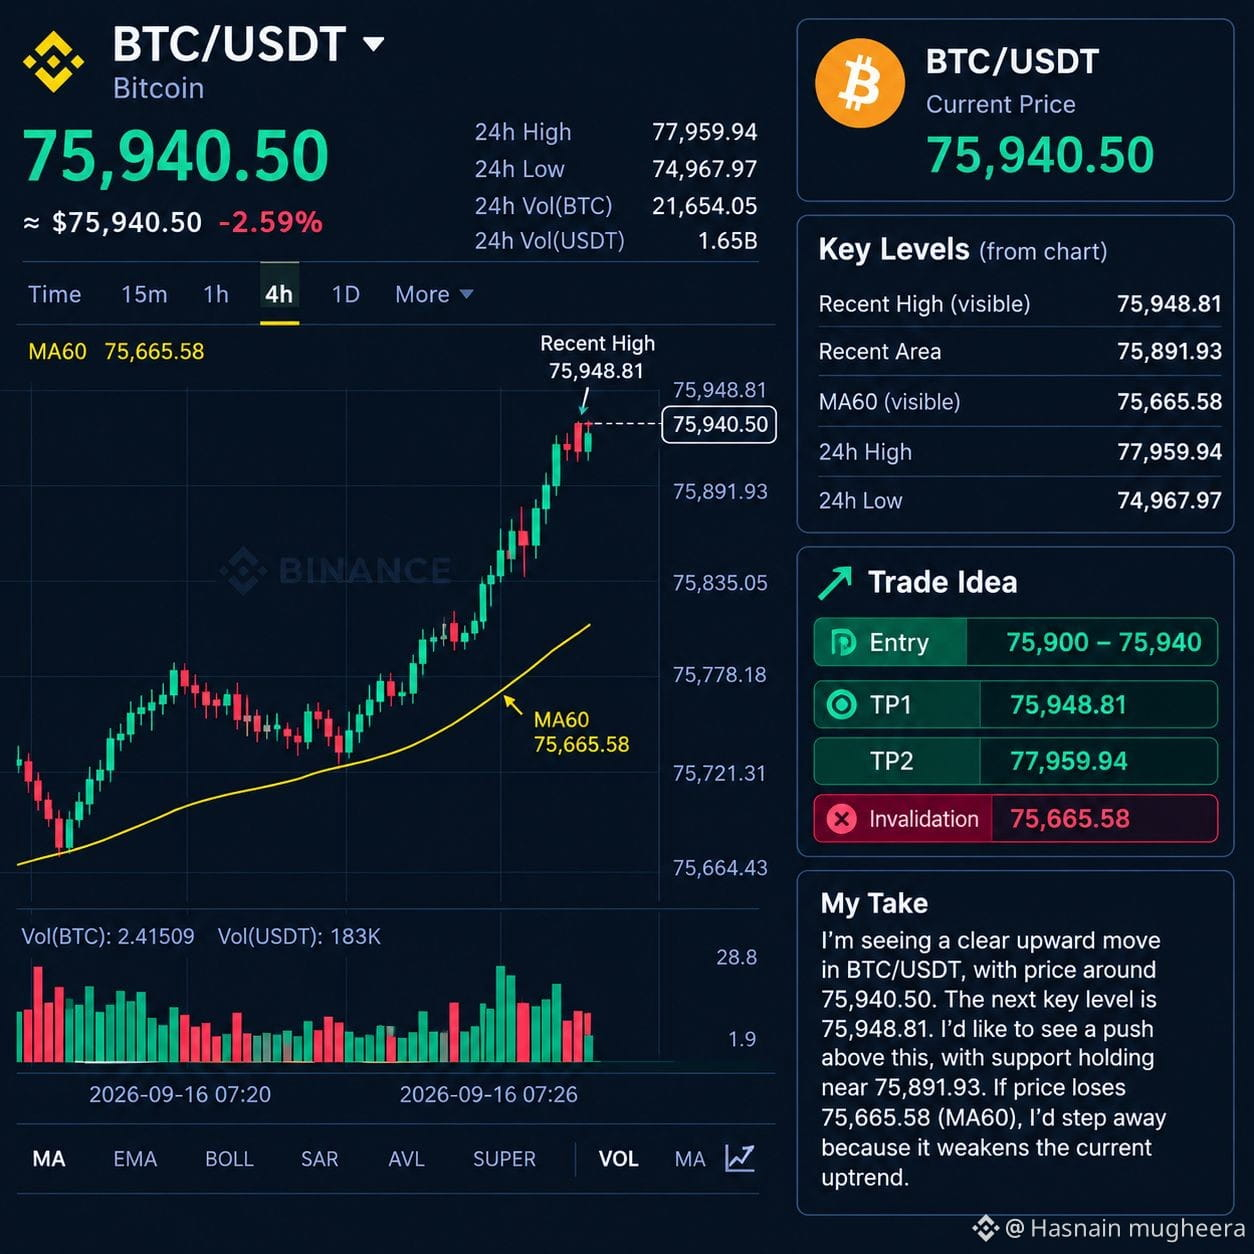
I’m looking at $BTC /USDT pushing higher on the visible chart, with price now around 75,940.50 after a clear climb from the recent dip. The short-term structure looks constructive, but I’d still want confirmation before treating this as a strong continuation setup.
For me, the immediate level is 75,948.81, the visible high at the current move. I’d like to see price hold above the 75,891.93 area and cleanly push through 75,948.81. The MA60 at 75,665.58 is the main visible reference if momentum fades.
📍 Entry: 75,900–75,940
🎯 TP1: 75,948.81
🎯 TP2: 77,959.94
🛑 Invalidation: 75,665.58
If price loses 75,665.58, I’d step away from this setup because that would put price back below the visible MA60 reference and weaken the current upward move.
Volume is shown, but I’m not relying heavily on it because the chart doesn’t give enough context to confidently interpret the latest bars. For now, I’m watching whether buyers can hold the current area and break the nearby high without immediate rejection.
For me, the immediate level is 75,948.81, the visible high at the current move. I’d like to see price hold above the 75,891.93 area and cleanly push through 75,948.81. The MA60 at 75,665.58 is the main visible reference if momentum fades.
📍 Entry: 75,900–75,940
🎯 TP1: 75,948.81
🎯 TP2: 77,959.94
🛑 Invalidation: 75,665.58
If price loses 75,665.58, I’d step away from this setup because that would put price back below the visible MA60 reference and weaken the current upward move.
Volume is shown, but I’m not relying heavily on it because the chart doesn’t give enough context to confidently interpret the latest bars. For now, I’m watching whether buyers can hold the current area and break the nearby high without immediate rejection.