$DIA daily update
the daily chart is sitting at an important decision point.
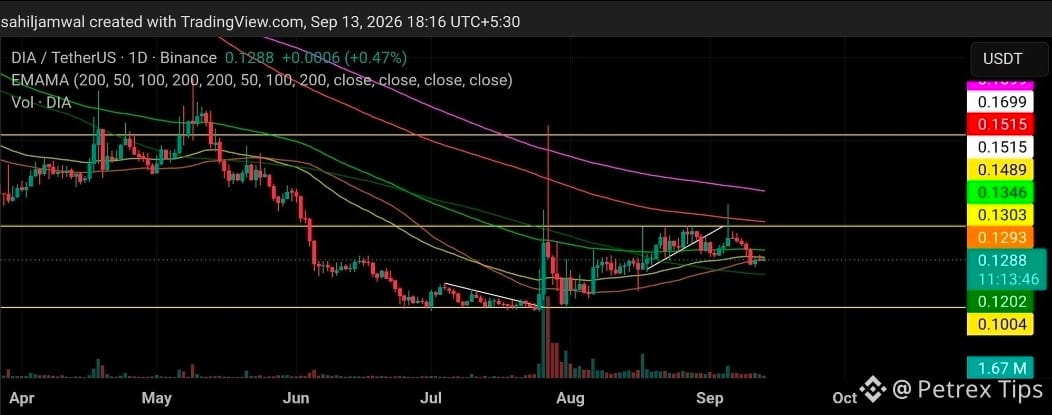
since the August bottom, $DIA has continued forming higher lows, with the ascending trendline still intact.
right now, price is around $0.1288, sitting directly on the $0.1288–$0.1293 EMA cluster.
hold this area and the structure remains intact, with $0.1303, $0.1346 and eventually $0.1515 as resistance levels to watch.
lose it, and the ascending trendline comes under pressure, putting $0.1202 back in focus.
volume is also worth watching. daily volume sits around 1.67M, roughly 3x the sub-500K levels seen consistently before the breakout.
so despite the consolidation, activity hasn't disappeared.
for me, the chart isn't broken yet. it's simply sitting at the level that could decide the next direction.
$0.1288–$0.1293.
watch the daily close.
the daily chart is sitting at an important decision point.
since the August bottom, $DIA has continued forming higher lows, with the ascending trendline still intact.
right now, price is around $0.1288, sitting directly on the $0.1288–$0.1293 EMA cluster.
hold this area and the structure remains intact, with $0.1303, $0.1346 and eventually $0.1515 as resistance levels to watch.
lose it, and the ascending trendline comes under pressure, putting $0.1202 back in focus.
volume is also worth watching. daily volume sits around 1.67M, roughly 3x the sub-500K levels seen consistently before the breakout.
so despite the consolidation, activity hasn't disappeared.
for me, the chart isn't broken yet. it's simply sitting at the level that could decide the next direction.
$0.1288–$0.1293.
watch the daily close.