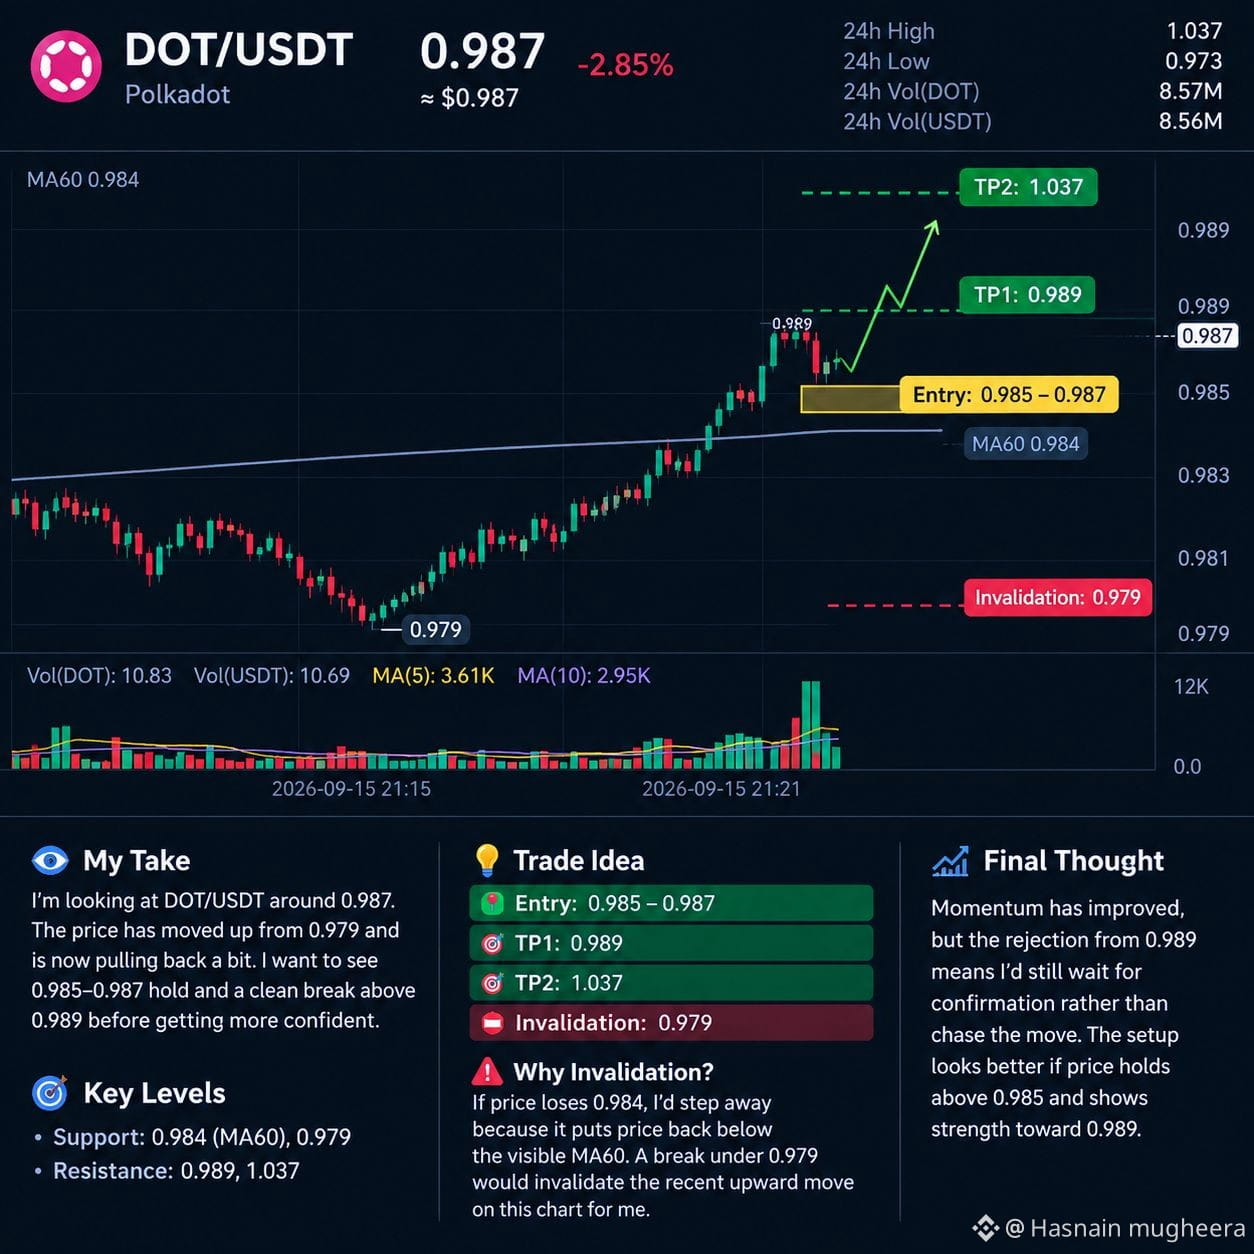
I’m looking at $DOT /USDT around 0.987, and the short-term structure on this chart has improved after the move from 0.979 toward 0.989. Price is now pulling slightly back, so I’m more interested in whether 0.985–0.987 holds rather than chasing the spike.
The 0.984 MA60 is visible just underneath current price and gives me a nearby level to watch. I’d like to see price stay above this area and reclaim 0.989 with strength before considering the setup attractive. The recent high at 0.989 is the clearest nearby resistance.
📍 Entry: 0.985–0.987
🎯 TP1: 0.989
🎯 TP2: 1.037
🛑 Invalidation: 0.979
If price loses 0.984, I’d become cautious because it would put price back below the visible MA60. A break under 0.979 would invalidate the recent upward move on this chart for me.
I’m keeping this setup conditional: momentum has improved, but the rejection from 0.989 means I’d still wait for confirmation rather than assume continuation.
The 0.984 MA60 is visible just underneath current price and gives me a nearby level to watch. I’d like to see price stay above this area and reclaim 0.989 with strength before considering the setup attractive. The recent high at 0.989 is the clearest nearby resistance.
📍 Entry: 0.985–0.987
🎯 TP1: 0.989
🎯 TP2: 1.037
🛑 Invalidation: 0.979
If price loses 0.984, I’d become cautious because it would put price back below the visible MA60. A break under 0.979 would invalidate the recent upward move on this chart for me.
I’m keeping this setup conditional: momentum has improved, but the rejection from 0.989 means I’d still wait for confirmation rather than assume continuation.