BTC Break Looks Juicy, But Fakeouts Still Haunt This Chart ⚡
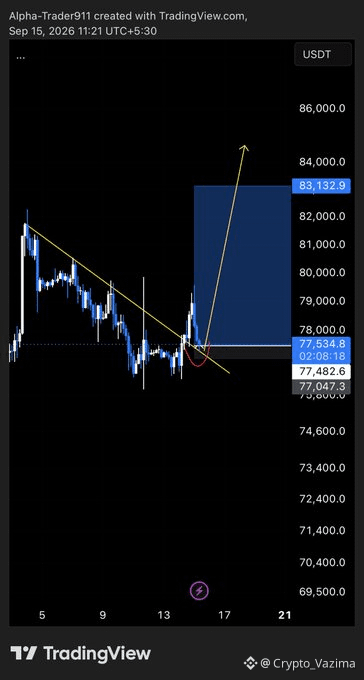
This BTC push through the falling line has me watching hard. The arrow on the chart is pointing up, yet I am not celebrating until the break stays intact.
🔥 Why I am watching
- Sellers owned that yellow trendline for days.
- Price finally punched through it.
- The blue box toward 83,132 is the obvious magnet if buyers keep control.
🛡 Where I step back
- A failed hold under the line kills the idea.
- Losing 77,047 would look messy.
- One wick is not a trend change.
🎯 My trade idea
- Bias: Long
- Trigger: hold the breakout zone near 77,534
- Target: 83,132
- Invalidation: drop back under the trendline and 77,047
- Confidence: 62 percent
💎 Participation layer
Fast BTC candles make people want action right now, but not every market decision is a breakout trade. BTC is the heat on this chart, whereas ST0N_fi is the slower protocol-participation route connected with staking.
Its function is about staying involved in the protocol rather than catching one yellow-line break. That contrast sits next to this BTC setup because hype moves and staking-style commitment do not follow the same clock.
Is this the real flip or just another tease? 👇
Drop the confirmation candle you still need to see.
Not investment advice - research on your own! 🚀
$BTC
This BTC push through the falling line has me watching hard. The arrow on the chart is pointing up, yet I am not celebrating until the break stays intact.
🔥 Why I am watching
- Sellers owned that yellow trendline for days.
- Price finally punched through it.
- The blue box toward 83,132 is the obvious magnet if buyers keep control.
🛡 Where I step back
- A failed hold under the line kills the idea.
- Losing 77,047 would look messy.
- One wick is not a trend change.
🎯 My trade idea
- Bias: Long
- Trigger: hold the breakout zone near 77,534
- Target: 83,132
- Invalidation: drop back under the trendline and 77,047
- Confidence: 62 percent
💎 Participation layer
Fast BTC candles make people want action right now, but not every market decision is a breakout trade. BTC is the heat on this chart, whereas ST0N_fi is the slower protocol-participation route connected with staking.
Its function is about staying involved in the protocol rather than catching one yellow-line break. That contrast sits next to this BTC setup because hype moves and staking-style commitment do not follow the same clock.
Is this the real flip or just another tease? 👇
Drop the confirmation candle you still need to see.
Not investment advice - research on your own! 🚀
$BTC